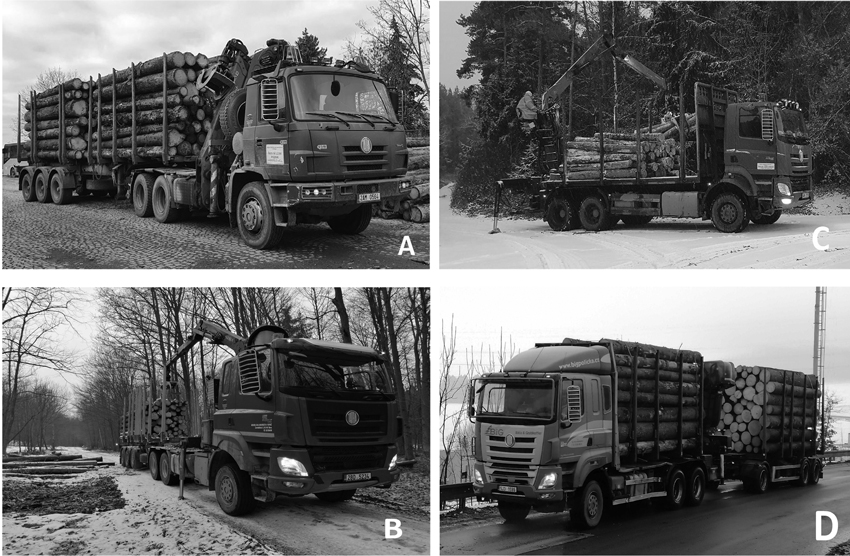
Fig. 1. Vehicles used in the experiment to evaluate the load environment of truck drivers. From top left A. Tatra 815, C. Tatra Phoenix I and down B. and D. Tatra Phoenix II.
| Table 1. Overview of the trucks’ technical parameters related to the truck drivers’ work environment. | |||||||||||
| Driving vehicle | Type of vehicle | Vehicle length / m | Vehicle weight / t | Load weight / t | Trailer length / m | Trailer weight / t | Load weight / t | Semi-trailer length / m | Semi-trailer weight / t | Load weight / t | Total length / m |
| Tatra 815 | truck with semi-trailer | 7.60 | 14.20 | 11.38 | 6.27 | 19.53 | 16.25 | ||||
| Tatra 815 | truck with trailer | 9.75 | 16.20 | 8.50 | 8.15 | 3.80 | 11.00 | 17.65 | |||
| Tatra Phoenix I | truck | 9.78 | 17.50 | 8.50 | 9.78 | ||||||
| Tatra Phoenix I | truck with trailer | 9.78 | 16.50 | 8.50 | 8.23 | 3.80 | 10.7 | 17.80 | |||
| Tatra Phoenix II | truck with semi-trailer | 8.06 | 14.94 | 11.23 | 7.27 | 17.79 | 16.45 | ||||
| Table 2. Muscle loading whilst driving a particular vehicle type at a particular point in a shift, and workdays. | |||
| Measuring cycle | Type of vehicle used | ||
| Logging truck with trailer | Logging truck | Passenger car | |
| % | |||
| Measuring cycle No. 1 | 170.8 | 101.0 | 100.0 |
| Measuring cycle No. 2 | 136.6 | 119.2 | 100.0 |
| Measuring cycle No. 3 | 136.7 | 119.2 | 100.0 |
| Measuring cycle No. 4 | 149.0 | 136.1 | 100.0 |
| Measuring cycle No. 5 | 151.9 | 101.4 | 100.0 |
| Measuring cycle No. 6 | 141.9 | 116.8 | 100.0 |
| Measuring cycle No. 7 | 147.1 | 121.0 | 100.0 |
| Measuring cycle No. 8 | 143.9 | 131.2 | 100.0 |
| Measuring cycle No. 9 | 146.4 | 144.3 | 100.0 |
| Measuring cycle No. 10 | 168.2 | 100.2 | 100.0 |
| Measuring cycle No. 11 | 138.9 | 121.1 | 100.0 |
| Measuring cycle No. 12 | 135.9 | 117.2 | 100.0 |
| Measuring cycle No. 13 | 149.8 | 135.8 | 100.0 |
| Measuring cycle No. 14 | 153.2 | 100.5 | 100.0 |
| Measuring cycle No. 15 | 142.5 | 117.6 | 100.0 |
| Measuring cycle No. 16 | 144.3 | 119.0 | 100.0 |
| Measuring cycle No. 17 | 156.1 | 128.1 | 100.0 |
| Measuring cycle No. 18 | 138.5 | 118.7 | 100.0 |
| Measuring cycle No. 19 | 134.2 | 121.6 | 100.0 |
| Measuring cycle No. 20 | 151.4 | 118.4 | 100.0 |
| Measuring cycle No. 21 | 140.5 | 123.7 | 100.0 |
| The table shows the differences in the muscle load of drivers when driving different types of vehicles in each measurement cycle. Routes using a significant proportion of roads class II and class III (over 60%) are marked with a dark background, routes using a significant proportion of driving distances on forest roads 1L and 2L (over 60%) are marked with a light background. | |||
| Table 3. Differentiated relative comparison of muscle loading when driving a vehicle type according to road type. | ||||||
| Type of vehicle | Relative muscle load compared to a car | |||||
| Total in % | Purpose-built roads 1L and 2L in % | On roads class II and III in % | ||||
| Logging truck with trailer | 146.5 | 122.5 | 141.2 | 116.6 | 159.1 | 152.5 |
| Logging truck | 119.6 | 121.1 | 104.3 | |||
| Passenger car | 100.0 | 100.0 | 100.0 | |||
| The table shows the differences in the muscle load of drivers when driving different types of vehicles on different types of roads used in the experiment. Routes using a significant proportion of roads class II and class III (over 60%) are marked with a dark background, routes using a significant proportion of driving distances on forest roads 1L and 2L (over 60%) are marked with a light background. | ||||||
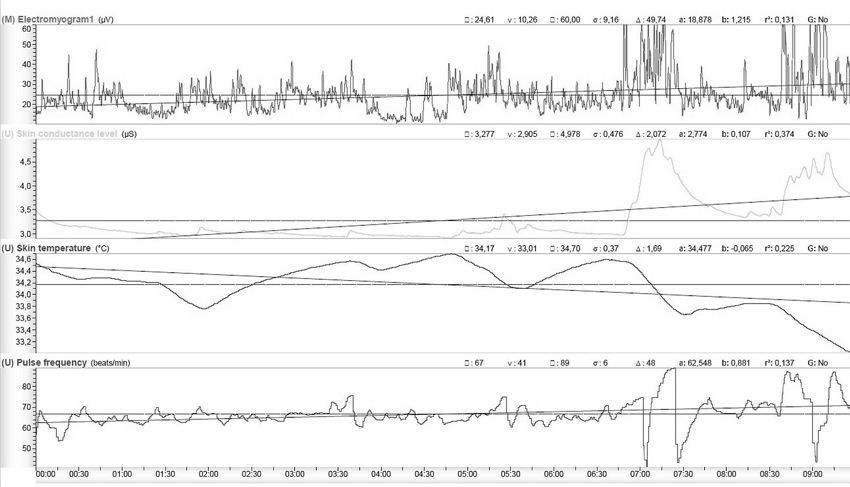
Fig. 2. Example record obtained physiological biosignals from electromyogram (EMG), galvanic skin response (SCL) measured on the hands, body temperature measured peripherally (ST) and heart rate (PF) - Example from measuring cycle No. 12. View larger in new window/tab.
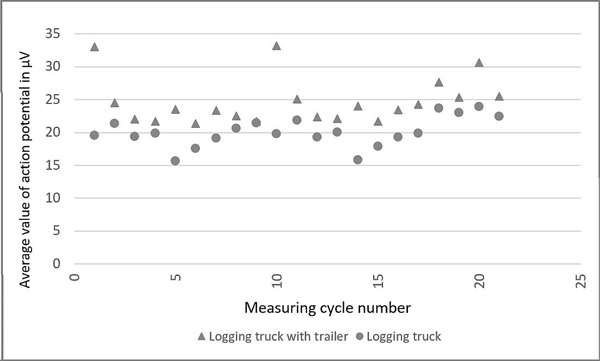
Fig. 3. Comparison of the course of the change in muscle load expressed in μV of electric potential in order of working routes when driving a timber truck with trailer and a logging truck without trailer.
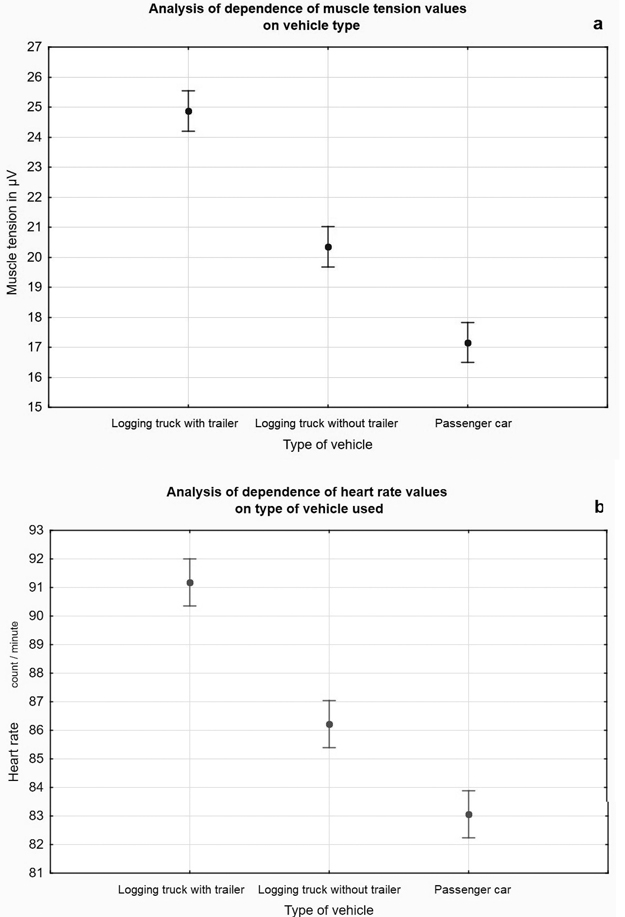
Fig. 4. Analysis of variance of dependence of values of muscle load (a) and heart rate (b) on type of vehicle used. Driving a logging truck with trailer increases muscle strain by approximately 22% and heart rate by approximately 6% compared to driving a logging truck. The average and limit values for the monitored vehicle types are displayed. The variance of the limits of measured values is ±2.8% for both muscle load and heart rate.
| Table 4. Analysis of variance of values of the dependence of muscle load and heart rate on the type of vehicle used, on the number of years’ experience, on body height, on the body weight and on the phase of the work shift. Gray text indicates statistical significance. | ||||||
| Effect | Sum of squares | Degrees of freedom | Meansquare | F-value | p-level of significance | |
| Type of vehicle | EMG | |||||
| Intercept | 81692.88 | 1 | 81692.88 | 11320.67 | 0.00 | |
| Type of vehicle | 1891.67 | 2 | 945.83 | 131.07 | 0.00 | |
| Error | 1342.22 | 186 | 7.22 | |||
| HEART RATE | ||||||
| Intercept | 1424631 | 1 | 1424631 | 130166.3 | 0.00 | |
| Type of vehicle | 2106 | 2 | 1053 | 96.2 | 0.00 | |
| Error | 2036 | 186 | 11 | |||
| Number of years‘ experience | EMG | |||||
| Intercept | 75885.56 | 1 | 75885.56 | 4699.469 | 0.00 | |
| Number of years’ experience | 262.72 | 4 | 65.68 | 4.067 | 0.003 | |
| Error | 2971.17 | 184 | 16.15 | |||
| HEART RATE | ||||||
| Intercept | 1297780 | 1 | 1297780 | 59923.58 | 0.00 | |
| Number of years’ experience | 157 | 4 | 39 | 1.81 | 0.128 | |
| Error | 3985 | 184 | 22 | |||
| Body height | EMG | |||||
| Intercept | 66450.07 | 1 | 66450.07 | 3991.386 | 0.00 | |
| Body height | 153.94 | 3 | 51.31 | 3.082 | 0.028 | |
| Error | 3079.95 | 185 | 16.65 | |||
| HEART RATE | ||||||
| Intercept | 1162537 | 1 | 1162537 | 53869.32 | 0.00 | |
| Body height | 149 | 3 | 50 | 2.31 | 0.078 | |
| Error | 3992 | 185 | 22 | |||
| Body weight | EMG | |||||
| Intercept | 75885.56 | 1 | 75885.56 | 4699.469 | 0.00 | |
| Body weight | 262.72 | 4 | 65.68 | 4.067 | 0.003 | |
| Error | 2971.17 | 184 | 16.15 | |||
| HEART RATE | ||||||
| Intercept | 1297780 | 1 | 1297780 | 59923.58 | 0.00 | |
| Body weight | 157 | 4 | 39 | 1.81 | 0.128 | |
| Error | 3985 | 184 | 22 | |||
| The driver’s muscle load is statistically significantly influenced by the type of vehicle used – especially its length and also the number of years of experience, but with regard to physical age. Body height, body weight and shift phase do not have a statistically significant effect on muscle load and heart rate. | ||||||
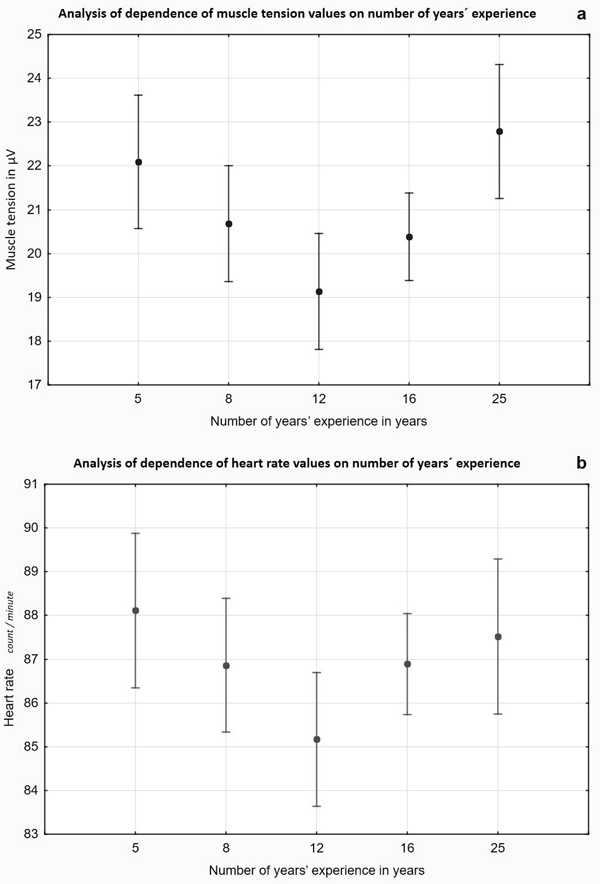
Fig. 5. Analysis of variance of dependence of values of muscle load (a) and heart rate (b) on number of years’ experience. The number of years’ experience significantly reduces muscle load and heart rate, but only until the moment when the effect of long-term hard work on the organism begins to manifest itself and subsequently the physical and mental load on the organism increases, up to the level of load with little years’ experience. The average and limit values for the monitored number of years’ experience displayed. Differences in muscle load range in the variance of the average values are up to 18% (the variance of the limits of measured values is ±6.8%); for heart rate, the variance is up to 3.6% (the variance of the limits of measured values is ±2.1%).
| Table 5. Post-hoc test to analyse the variance of values of the dependence of muscle load values on the number of years’ experience, the driver’s height and the driver’s body weight. Gray numbers indicates statistical significance. | ||||||
| Scheffe‘s test; EMG variable Probabilities for post-hoc tests Error: intermediate. SS = 16.148, AS = 184.00 | ||||||
| Number of years’ experience | 5 | 8 | 12 | 16 | 25 | |
| Number of years’ experience | 5 | |||||
| 8 | 0.752 | |||||
| 12 | 0.083 | 0.617 | ||||
| 16 | 0.494 | 0.998 | 0.694 | |||
| 25 | 0.982 | 0.377 | 0.014 | 0.155 | ||
| Body height | 171 | 176 | 178 | 182 | ||
| Body height | 171 | |||||
| 176 | 0.604 | |||||
| 178 | 0.749 | 0.963 | ||||
| 182 | 0.046 | 0.463 | 0.115 | |||
| Body weight | 72 | 87 | 89 | 93 | 94 | |
| Body weight | 72 | |||||
| 87 | 0.752 | |||||
| 89 | 0.083 | 0.617 | ||||
| 93 | 0.982 | 0.377 | 0.014 | |||
| 94 | 0.494 | 0.998 | 0.694 | 0.155 | ||
| The measured values for the individual monitored parameters were compared in the groups of the number of years of experience, body height and body weight of the driver. | ||||||
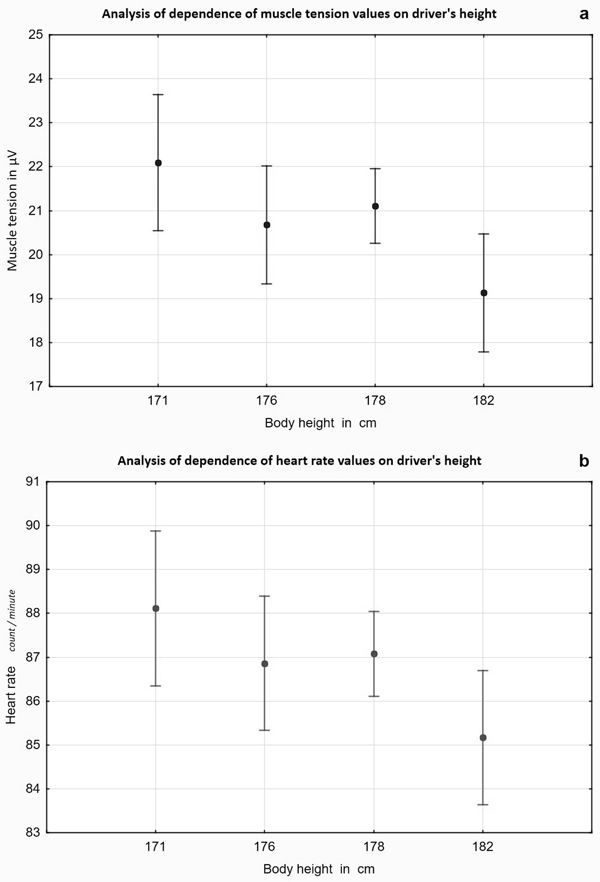
Fig. 6. Analysis of variance of dependence of values of muscle load (a) and heart rate (b) on height of operator. The dependence of muscle load and heart rate on body height is related to the relationship between body height and workplace ergonomics. A shorter driver will expend more energy reaching for controls and steering. The average and limit values for the monitored body heights displayed. Differences in muscle load range in the variance of the average values are up to 15% (the variance of the limits of measured values is ±6.6%); for heart rate, the variance is up to 3.6% (the variance of the limits of measured values is ±1.7%).
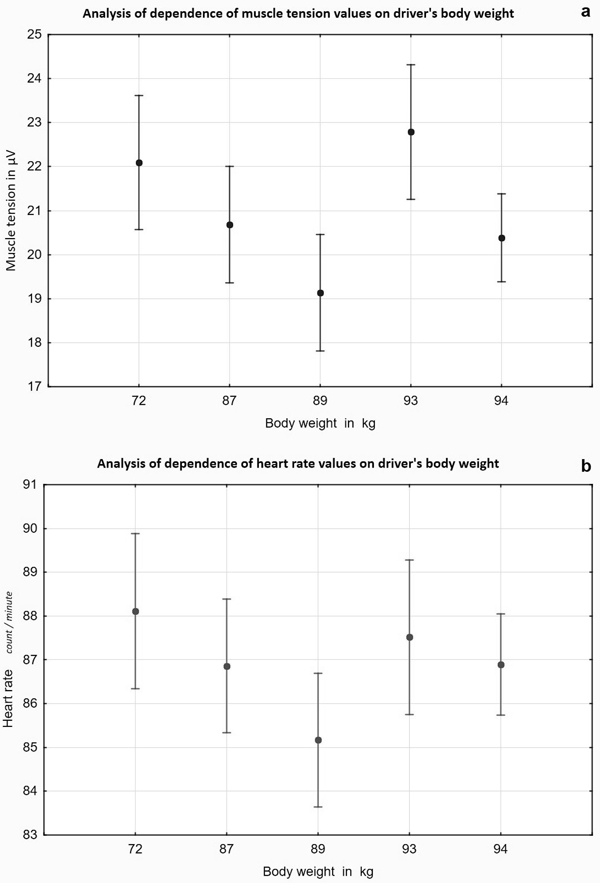
Fig. 7. Analysis of variance of dependence of values of muscle load (a) and heart rate (b) on weight of operator. The dependence of muscle load and heart rate on body weight is related to the relationship between body weight and workplace ergonomics. The lower weight of the driver increases their physical workload when controlling the vehicle i.e. the need to use more force to control the vehicle. The average and limit values for the monitored body weights displayed. Differences in muscle load range in the variance of the average values are up to 15.2% (the variance of the limits of measured values is ±7.3%); for heart rate, the variance is up to 3.6% (the variance of the limits of measured values is ±1.9%).
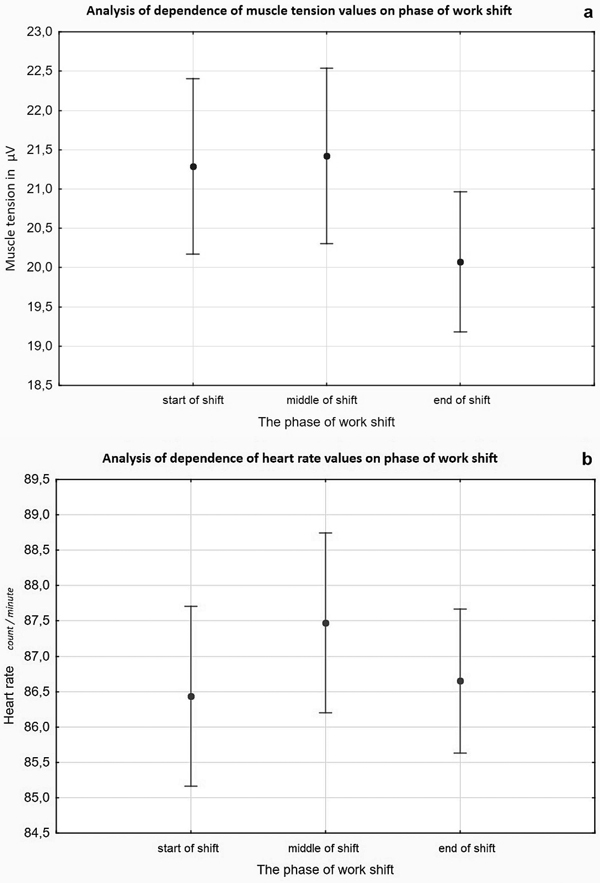
Fig. 8. Analysis of variance of dependence of values of muscle load (a) and heart rate (b) on phase of work shift. The dependence of muscle load and heart rate on the phase of the work shift did not show significant differences in load. The average and limit values for the monitored phases of work shift displayed. Differences in muscle load range in the variance of the average values are up to 6.4% (the variance of the limits of measured values is ±5.4%); for heart rate, the variance is up to 1.2% (the variance of the limits of measured values is ±1.5%). The middle part of the work shift, when work performance is at full capacity, shows the expected highest load. The loads at the beginning and at the end of the shift were lower because, at these times, empty vehicles were moved to the pick-up points or the empty vehicle was returned from the dispatch warehouse to the parking area.