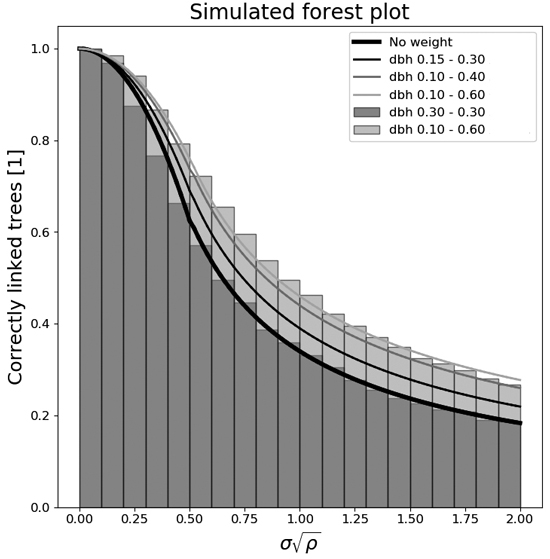
Fig. 1. The number of correctly linked trees in field plots as a function of the normalized radial displacement standard deviation for several different diameter spans of simulated forests. The stand densities used are from an equal amount of 500, 1000, and 1500 stems ha–1.
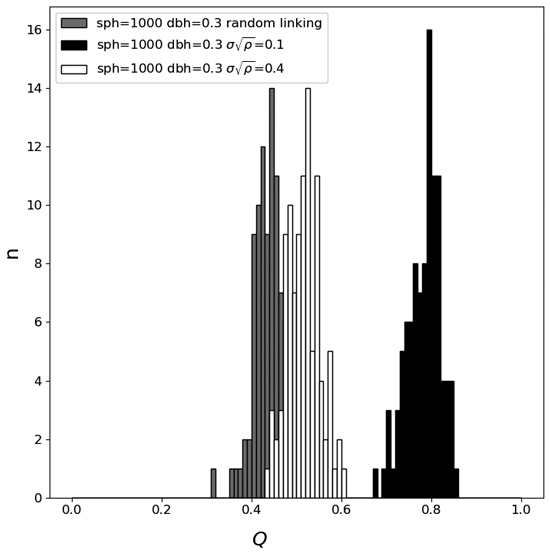
Fig. 2. The co-registration quality metric Q distributions for plots with randomly linked trees and plots with correctly linked trees for two different normalized radial displacement standard deviations. The number of stems ha–1 (sph) was set to 1000 and the diameter at breast height (dbh) was 0.3.
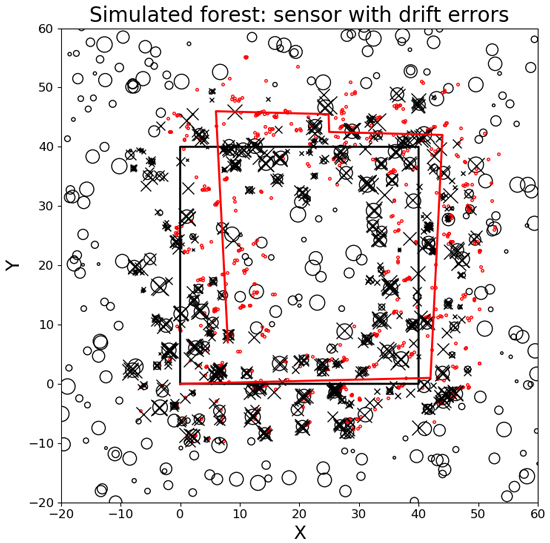
Fig. 3. A simulation of a moving sensor with drift errors co-registering a forest stand. The black circles are trees from the forest stand with diameters proportional to the size of the trees. The black rectangle is the true sensor path, and the red track is the sensor path with errors. The small red dots are the tree positions with errors and the black x’s are the tree positions after co-registration.
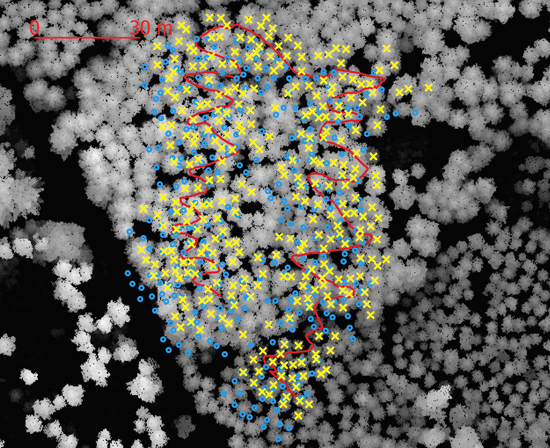
Fig. 4. Co-registration of aerially detected stem positions and ground reference stem positions of a forest stand using the algorithm described in the paper. Blue circles are stem positions before co-registration and yellow x’s are stem positions after co-registration. The red curvy line is the sensor path. The gray background is the canopy height model derived from airborne laser scanner data.
| Table 1. Number of detected trees [%] at different settings of the span of diameter at breast height and normalized standard deviation of the position error σ√ρ. The average of simulated plots 500, 1000, and 1500 stems per hectare were used. | ||||||
| σ√ρ | Dbh 30 cm | Dbh 15–30 cm | Dbh 10–30 cm | Dbh 10–40 cm | Dbh 10–50 cm | Dbh 10–60 cm |
| 0.05 | 99.9 | 99.9 | 100.0 | 100.0 | 99.9 | 100.0 |
| 0.15 | 96.8 | 98.0 | 98.4 | 98.5 | 98.4 | 98.6 |
| 0.25 | 87.6 | 91.5 | 92.3 | 92.6 | 93.6 | 94.1 |
| 0.35 | 76.6 | 82.6 | 83.9 | 85.5 | 86.0 | 86.7 |
| 0.45 | 66.2 | 72.3 | 75.7 | 76.9 | 77.7 | 79.4 |
| 0.55 | 57.1 | 64.7 | 67.2 | 69.4 | 70.4 | 72.2 |
| 0.65 | 49.6 | 56.2 | 60.4 | 63.4 | 64.5 | 65.5 |
| 0.75 | 44.6 | 51.1 | 53.7 | 56.3 | 58.0 | 59.6 |
| 0.85 | 38.7 | 46.7 | 49.7 | 50.7 | 53.3 | 53.9 |
| 0.95 | 35.9 | 41.4 | 45.4 | 47.4 | 48.6 | 49.6 |
| 1.05 | 33.1 | 38.5 | 41.8 | 43.6 | 45.3 | 46.2 |
| σ = stem position radial displacement standard deviation. ρ = the number of stems m–2. Dbh = diameter at breast height. | ||||||
| Table 2. Curve fitted function parameters for detection rates in the simulations with different diameter settings at breast height ratio and different numbers of stems per hectare. | |||||||
| Dbh [m] | Dbh ratio | Sph [ha–1] | C1 | p1 | C2 | p2 | Rmse |
| 0.30–0.30 | 1.0 | all | 1.5 | 2.0 | 0.34 | –0.89 | 0.101 |
| 0.30–0.30 | 1.0 | 500 | 1.55 | 2.0 | 0.34 | –0.86 | 0.127 |
| 0.30–0.30 | 1.0 | 1000 | 1.49 | 2.0 | 0.33 | –0.91 | 0.086 |
| 0.30–0.30 | 1.0 | 1500 | 1.47 | 2.0 | 0.34 | –0.9 | 0.081 |
| 0.15–0.30 | 2.0 | all | 1.24 | 2.0 | 0.39 | –0.83 | 0.102 |
| 0.15–0.30 | 2.0 | 500 | 1.29 | 2.0 | 0.39 | –0.8 | 0.132 |
| 0.15–0.30 | 2.0 | 1000 | 1.23 | 2.0 | 0.39 | –0.84 | 0.088 |
| 0.15–0.30 | 2.0 | 1500 | 1.2 | 2.0 | 0.39 | –0.85 | 0.075 |
| 0.10–0.40 | 4.0 | all | 1.05 | 2.0 | 0.44 | –0.76 | 0.099 |
| 0.10–0.40 | 4.0 | 500 | 1.07 | 2.0 | 0.44 | –0.74 | 0.127 |
| 0.10–0.40 | 4.0 | 1000 | 1.05 | 2.0 | 0.43 | –0.76 | 0.089 |
| 0.10–0.40 | 4.0 | 1500 | 1.02 | 2.0 | 0.43 | –0.78 | 0.073 |
| Dbh = diameter at breast height. Sph = stems per hectare. all = an equal amount of 500, 1000 and 1500 Sph. Dbh ratio = the maximum possible Dbh in the span divided by the minimum possible Dbh in the span. Rmse = root mean square error of model fit residuals. | |||||||
| Table 3. Statistics of the co-registration quality metric Q for different number of stems ha–1 for randomly combined plots. These values are used to set a minimum Q threshold for the level of possible correctly-linked field plots. Values lower than this are probably caused by incorrect co-registrations. | ||||
| Stems ha–1 | avg Q | StdDev Q | Avg + 3 stdDev | Probability Q < 0.55 [%] |
| 500 | 0.416 | 0.0520 | 0.572 | 99.51 |
| 1000 | 0.442 | 0.0372 | 0.553 | 99.82 |
| 1500 | 0.459 | 0.0288 | 0.545 | 99.92 |
| avg = average. StdDev = population standard deviation. | ||||
| Table 4. Statistics for the co-registration quality metric Q for different number of stems ha–1, and normalized position error standard deviation σ√ρ, for correctly co-registered plots. Small stem position errors make it easier to separate a correct co-registration from an incorrect one. | |||
| Stems ha–1 | σ√ρ | Dbh [m] | Probability (Q > 0.55) [%] |
| 500 | 0.1 | 0.3–0.3 | 100.0 |
| 500 | 0.1 | 0.1–0.6 | 100.0 |
| 1000 | 0.1 | 0.3–0.3 | 100.0 |
| 1000 | 0.1 | 0.1–0.6 | 100.0 |
| 500 | 0.2 | 0.3–0.3 | 83.53 |
| 500 | 0.2 | 0.1–0.6 | 91.4 |
| 1000 | 0.2 | 0.3–0.3 | 99.06 |
| 1000 | 0.2 | 0.1–0.6 | 99.96 |
| 500 | 0.3 | 0.3–0.3 | 31.36 |
| 500 | 0.3 | 0.1–0.6 | 31.72 |
| 1000 | 0.3 | 0.3–0.3 | 66.78 |
| 1000 | 0.3 | 0.1–0.6 | 79.04 |
| 500 | 0.4 | 0.3–0.3 | 3.93 |
| 500 | 0.4 | 0.1–0.6 | 10.93 |
| 1000 | 0.4 | 0.3–0.3 | 16.82 |
| 1000 | 0.4 | 0.1–0.6 | 27.25 |
| Dbh = the diameter at breast height. σ = stem position radial displacement standard deviation. ρ = the number of stems m–2. | |||