| Table 1. Geographical location of fourteen sampled populations of Tetraclinis articulata and genetic diversity estimates. P percentage of polymorphic loci, H0 Nei’s heterozygosity (genetic diversity), H0* Nei’s heterozygosity calculated for a standardised population size of 10, Hs mean heterozygosity within populations, Ht total heterozygosity between populations, Gst index of population differentiation. | ||||||||
| Population | Location | Individuals sampled | (P) % polymorph. loci | H0 | H0* | Hs | Ht | Gst |
| Algeria | ||||||||
| 1 Zemmora | 38°42.80´N, 0°45.36´E | 10 | 48.06 | 0.159 | 0.159 | |||
| 2 El Fedjoudj | 36°30.40´N, 7°21.70´E | 10 | 45.37 | 0.178 | 0.178 | |||
| 3 Saida | 34°50.45´N, 0°04.63´E | 10 | 39.14 | 0.160 | 0.160 | |||
| Morocco | ||||||||
| 4 Khenifra | 33°05.69´N, 5°35.03´W | 10 | 37.40 | 0.153 | 0.153 | |||
| 5 El Ksiba | 32°34.35´N, 6°02.81´W | 21 | 64.63 | 0.206 | 0.201 | |||
| 6 Oujda | 34°30.92´N, 1°54.21´W | 20 | 60.98 | 0.184 | 0.174 | |||
| 7 Hassi Berkane | 34°43.60´N, 2°47.60´W | 10 | 45.07 | 0.154 | 0.154 | |||
| 8 Ain el Aouda | 33°44.66´N, 6°45.05´W | 21 | 68.29 | 0.204 | 0.195 | |||
| Malta | ||||||||
| 9 Wied Mizieb | 35°51.89´N, 14°24.17´E | 31 | 73.17 | 0.183 | 0.154 | |||
| 10 Argotti | 35°53.48´N, 14°30.11´E | 14 | 53.66 | 0.161 | 0.169 | |||
| 11 Gnien Ingraw | 35°57.71´N, 14°21.48´E | 20 | 79.27 | 0.231 | 0.205 | |||
| Spain | ||||||||
| 12 Cenizas | 37°35.49´N, 0°49.67´W | 14 | 69.51 | 0.227 | 0.195 | |||
| 13 Sabinar | 37°37.22´N, 0°47.87´W | 14 | 60.98 | 0.201 | 0.190 | |||
| Tunisia | ||||||||
| 14 Cape Bon | 37°04.27´N, 11°04.27´E | 10 | 47.56 | 0.151 | 0.151 | |||
| Total | 215 | 97.56 | 0.179 | 0.258 | 0.31 | |||
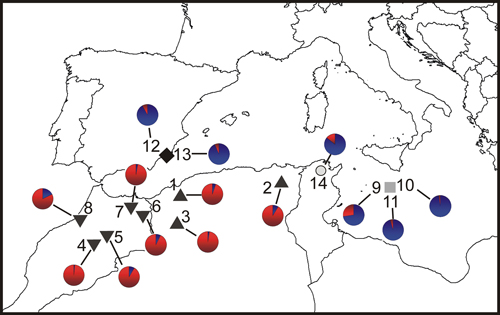
Fig. 1. Location map and Bayesian analysis of the genetic structure of 215 individuals from fourteen sampled populations of T. articulata. Pie charts represent the mean proportion of membership to the predefined K = 2 clusters with the highest ΔK obtained following Evanno et al. (2005). Inverted triangles, Morocco populations; triangles, Algeria populations; grey square, Malta populations; dark diamond, Spain populations; open circle, Tunisia population.
| Table 2. ISSR primers used to generate multilocus profiles with DNA from T. articulata. | ||||
| Primer | Sequence | Range | No. bands | % polymorphic |
| OLIGO1 | (GT)6RG | 200–1220 | 20 | 100 |
| OLIGO4 | (GT)6AY | 190–1310 | 12 | 100 |
| UBC857 | (AC)8YG | 220–1405 | 18 | 100 |
| UBC881 | (GGGT)3G | 200–1550 | 16 | 87.5 |
| OW12 | (GA)8YA | 230–1330 | 16 | 100 |
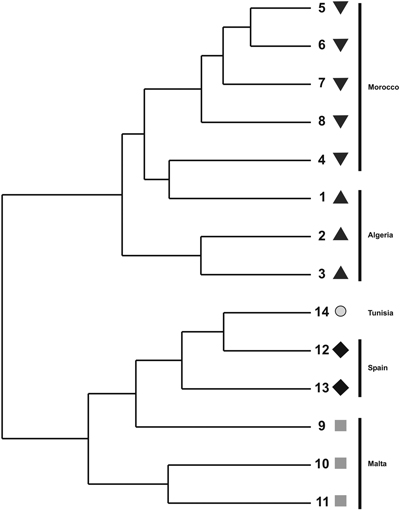
Fig. 2. UPGMA dendrogram constructed using pair-wise Nei’s (1973) genetic distance derived by ISSR analysis for populations of T. articulata.
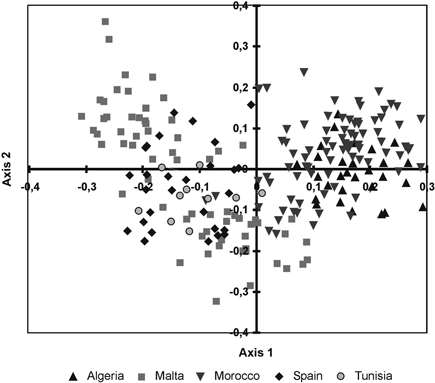
Fig. 3. Principal coordinate analysis of the 215 individuals from fourteen sampled populations of T. articulata based on pair-wise Nei’s (1973) genetic distances.