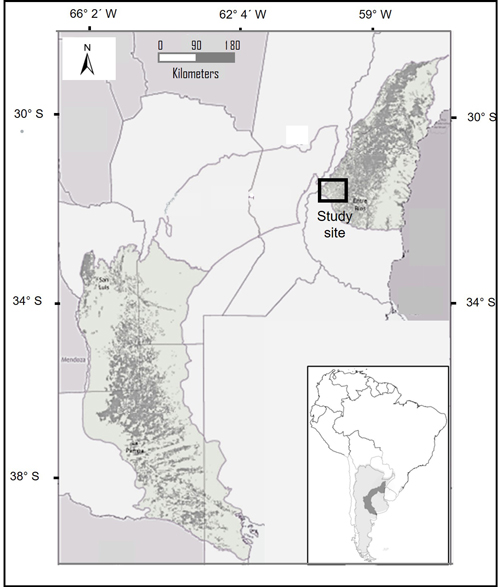
Fig. 1. Location of the study area (Espinal phytogeographic province). Entre Ríos, Argentina (adapted from MAyDS 2020).
| Table 1. General characteristics of forest soils in the study area. | |||
| Soil horizons | Source | ||
| A | B1 | ||
| Depth (cm) | 0–12 | 12–25 | Plan Mapa Suelos (1998) |
| Textural class | silty clay loam | silty clay loam | Plan Mapa Suelos (1998) |
| Sand (g kg–1 soil) | 17 | 20 | Plan Mapa Suelos (1998) |
| Silt (g kg–1 soil) | 667 | 662 | Plan Mapa Suelos (1998) |
| Clay (g kg–1 soil) | 316 | 318 | Plan Mapa Suelos (1998) |
| Bulk density (g cm–3) | 1.26 | 1.19 | Own data |
| Organic carbon (mg g–1 soil) | 30.5 | 18.9 | Own data |
| Total nitrogen (mg g–1 soil) | 2.8 | 1.8 | Own data |
| C:N ratio | 10.9 | 10.5 | Own data |
| Table 2. Number of sampled trees per each diameter class size. | |||||||
| Species | Diameter classes (cm) | ||||||
| 5–10 | 10–15 | 15–20 | 20–25 | 25–30 | 30–35 | >35.0 | |
| Neltuma affinis | 6 | 6 | 6 | 6 | 6 | - | - |
| Neltuma nigra | 4 | 4 | 5 | 6 | 4 | 4 | 3 |
| Vachellia caven | 9 | 7 | 7 | 7 | - | - | - |
| Table 3. Mean values of C and N concentrations (mg g–1 DM) for each species (Neltuma affinis, Neltuma nigra and Vachellia caven) and biomass compartment. Different letters indicate statistically significant differences (LSD Fisher p ≤ 0.05) between biomass compartments for the same species. sbl: small branches (diameter ≤ 5 cm) + leaves, flowers and fruits; lb: large branches (diameter > 5 cm); st: stem. | ||||
| Species | Biomass compartment | Carbon concentration (mg g–1 DM) | Nitrogen concentration (mg g–1 DM) | C:N ratio |
| Neltuma affinis | sbl | 457.4 ± 17.4a | 19.1 ± 2.1a | 23.8 ± 2.5a |
| lb | 481.6 ± 12.3b | 10.3 ± 3.2b | 49.0 ± 12.6b | |
| st | 484.9 ± 25.2b | 8.0 ± 3.1b | 69.2 ± 23.6c | |
| Neltuma nigra | sbl | 482.8 ± 6.0ª | 22.8 ± 2.2a | 21.4 ± 2.0a |
| lb | 474.2 ± 11.2b | 7.9 ± 1.2b | 61.3 ± 9.1b | |
| st | 485.5 ± 10.5a | 6.1 ± 1.3b | 83.4 ± 18.8c | |
| Vachellia caven | sbl | 483.8 ± 9.1ª | 18.0 ± 1.8ª | 27.1 ± 2.5a |
| lb | 468.4 ± 7.6b | 7.8 ± 3.3b | 66.0 ± 16.4b | |
| st | 476.0 ± 9.7c | 5.0 ± 1.7b | 104.8 ± 29.7c | |
| Table 4. Biomass allocation compartments for each species, carbon and nitrogen concentration and C:N ratio (n = 30 for each species). | ||||||
| Species | Compartments participation in aboveground biomass * (mean ± SD) | Balanced aboveground biomass carbon concentration (mg g−1 DM) | Balanced aboveground biomass nitrogen concentration (mg g−1 DM) | Balanced C:N ratio | ||
| small branches, leaves, flowers and fruits (sbl %) | large branches (lb %) | stems (st %) | ||||
| Neltuma affinis | 41.9 ± 6.8 | 25.3 ± 13.6 | 32.8 ± 10.7 | 472.6 | 13.2 | 45.1 |
| Neltuma nigra | 38.0 ± 9.9 | 34.7 ± 17.4 | 27.3 ± 12.8 | 480.0 | 12.4 | 52.2 |
| Vachellia caven | 52.8 ± 9.1 | 23.1 ± 13.9 | 24.1 ± 8.9 | 478.5 | 12.5 | 54.8 |
| * Values from Sione et al. (2019) and Sione et al. (2020a,b) | ||||||
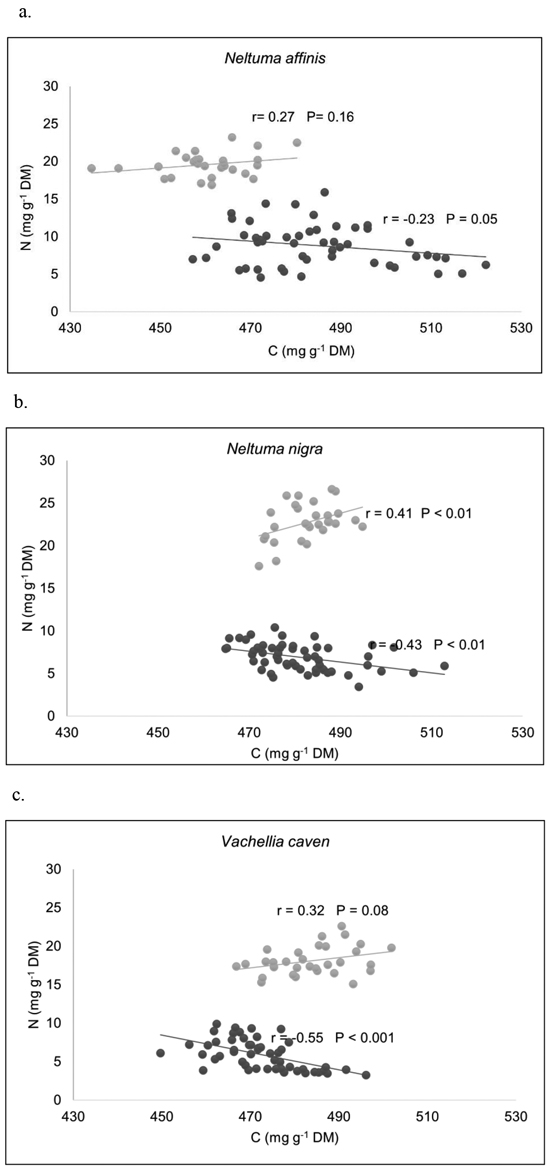
Fig. 2. Relationships between C and N concentrations among biomass compartments, for (a) Neltuma affinis, (b) Neltuma nigra, and (c) Vachellia caven. Pearson’s correlation coefficients (r) showed that C was positively correlated with N in sbl, being significant only in N. nigra. In the group made up of lb and st, the relationship between C and N concentrations resulted negative in all species, being significant in N. nigra and V. caven. DM: dry mass. Legend to a–c: ● = Small branches (diámeter ≤ 5 cm) + leaves + flowers + fruits; ● = stems + large branches.
| Table 5. Biometric-scaling model to evaluate whether N concentrations scale isometrically with respect to C concentrations among biomass compartments. lb: large branches (diameter > 5 cm); st: stem; sbl: small branches (diameter ≤ 5 cm) + leaves, flowers and fruits. Scaling slopes not significantly different from 1.0 indicates isometric C–N scaling relationships. | ||
| Species | Compartment | |
| lb + st | sbl | |
| Neltuma affinis | log N = –2.16 log C + 6.72 | log N = 0.96 log C – 1.27 |
| Neltuma nigra | log N = –4.68 log C + 13.37 | log N = 3.42 log C – 7.82 |
| Vachellia caven | log N = –9.77 log C + 26.89 | log N = 1.68 log C – 3.26 |
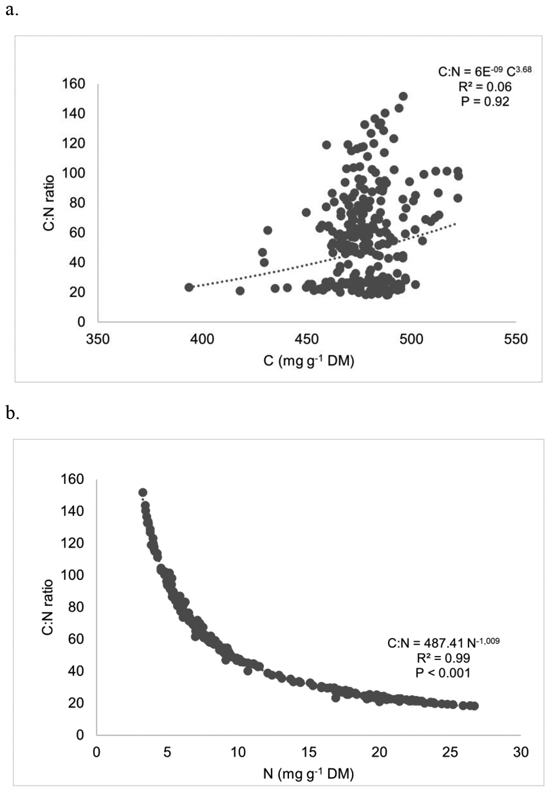
Fig. 3. Regressing C:N ratios against (a) carbon and (b) nitrogen in whole plants (all species). Each point represents a compartment (st, lb or sbl) of a certain individual (n = 254).
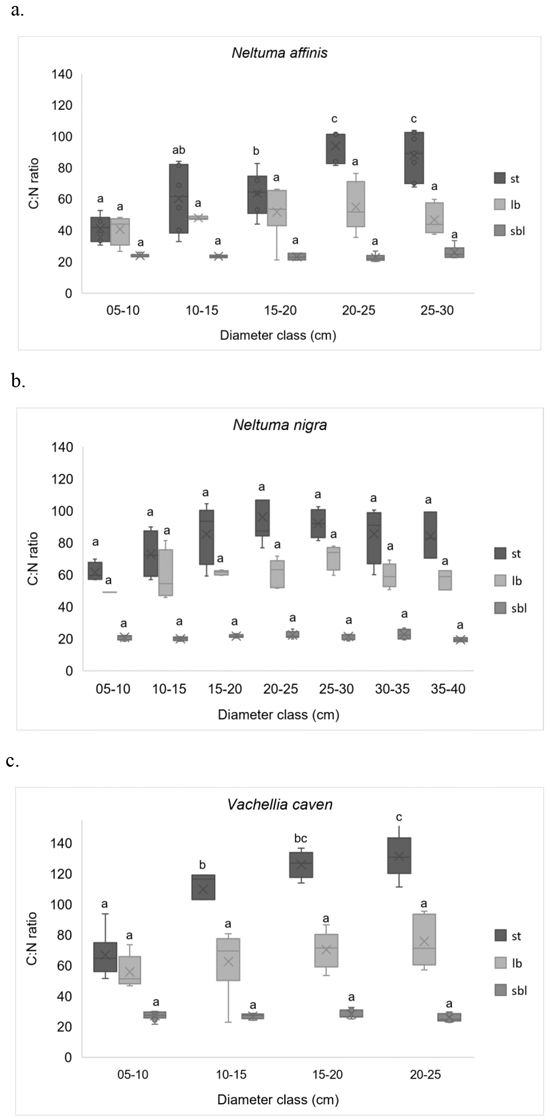
Fig. 4. C:N ratios in different compartments, by diameter classes. (a) Neltuma affinis; (b) Neltuma nigra, and (c) Vachellia caven. Different letters indicate statistically significant differences (LSD Fisher p ≤ 0.05) between diameter classes for the same compartment. sbl: small branches (diameter ≤ 5 cm) + leaves, flowers and fruits; lb: large branches (diameter > 5 cm); st: stems. The “X”s inside the boxes indicates the mean of the data being plotted.