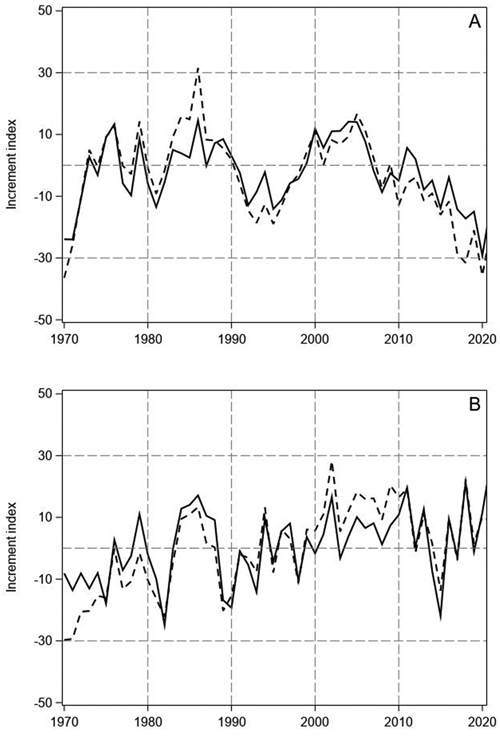
Fig. 1. Tree-ring indices of Scots pine (A) and Norway spruce (B) on mineral soil (continuous line) and on peatlands (dashed line) in North Finland.
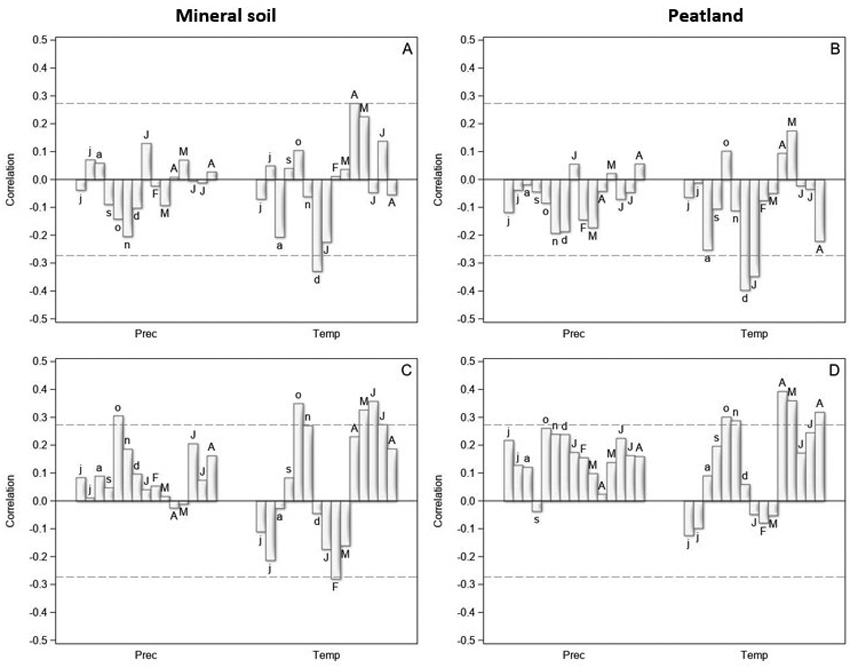
Fig. 2. The correlation coefficients between the tree-ring indices and monthly precipitation sums (Prec) and mean temperatures (Temp) from June of the previous year (small letters) to August of the current year (capital letters) in years 1970–2021 for Scots pine (upper row) and Norway spruce (lower row) on mineral soil (left column) and on peatland (right column) in North Finland. The dashed horizontal lines are 0.05 significance levels.
| Table 1. Parameter estimates and their standard errors (S.E.) of the tree-ring index models in years 1970–2021 for Scots pine and Norway spruce on mineral soil and peatlands in North Finland. | ||||
| Scots pine | Norway spruce | |||
| Parameter | S.E. | Parameter | S.E. | |
| Mineral soil | ||||
| Int. | –0.625 | 0.373 | –1.257 | 0.246 |
| T–12,1 | –0.012 | 0.004 | - | |
| T2,3 | - | –0.018 | 0.005 | |
| ln(T4,5) | 0.082 | 0.028 | 0.064 | 0.027 |
| ln(T6) | - | 0.420 | 0.096 | |
| ln(T7) | 0.152 | 0.137 | - | |
| Flower | –0.061 | 0.051 | - | |
| Dry | –0.127 | 0.052 | - | |
| R2 | 0.34 | 0.44 | ||
| Pr<DW | <0.01 | <0.01 | ||
| Peatland | ||||
| Int. | –0.289 | 0.066 | –0.921 | 0.503 |
| T–12,1 | –0.020 | 0005 | - | |
| ln(T4,5) | 0.081 | 0.039 | 0.111 | 0.038 |
| ln(T7) | - | 0.291 | 0.186 | |
| Flower | –0.083 | 0.071 | - | |
| Dry | –0.188 | 0.071 | - | |
| R2 | 0.33 | 0.21 | ||
| Pr<DW | <0.01 | <0.01 | ||
| T–12,1: mean temperature of previous year December and current year January T2,3: mean temperature of current year February and March T4,5: mean temperature of current year April and May T6: mean temperature of current year June T7: mean temperature of current year July Flower: intensity of flowering and cone production Dry: intensity of drought in current year July Pr<DW: p-value for testing positive autocorrelation | ||||
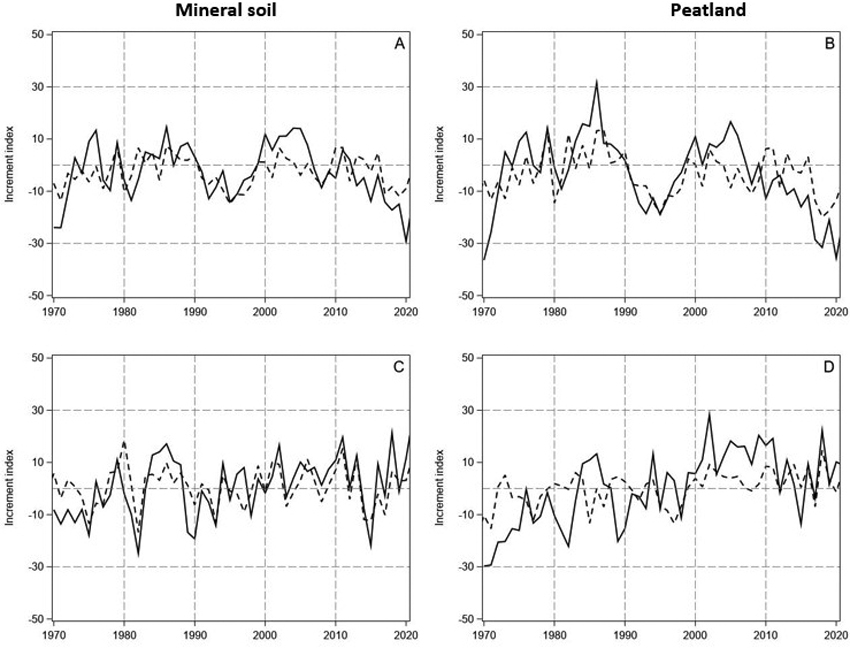
Fig. 3. The measured and predicted tree-ring indices (continuous and dashed lines, respectively) for Scots pine (A and B, upper row) and Norway spruce (C and D, lower row) in years 1970–2021 on mineral soil (left column) and on peatland (right column) in North Finland. The indices were predicted by using the models in Table 1.