| Table 1. Number of stands, plots and total area in the 182 surveyed tracts. Arithmetic mean values with one SE of the mean within brackets. | |||
| Total | per stand | per tract | |
| Stands (no) | 450 | 2.5 (0.09) | |
| Plots (no) | 2052 | 4.6 (0.17) | 11.3 (0.51) |
| Area (ha) | 2134 | 4.7 (0.22) | 11.7 (0.64) |
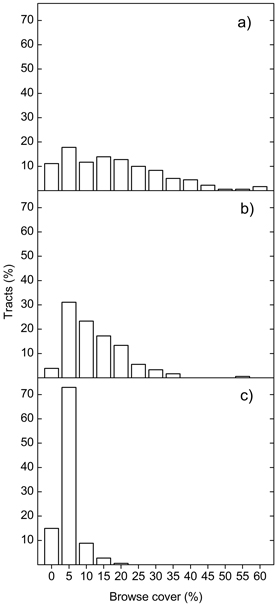
Fig. 1. Frequencies of tracts with different average cover of Scots pine (a), birch (b) and RAW (c) browse. Values on the x-axis denote class upper limits, except for the 0-class. RAW = rowan, aspen, willows.
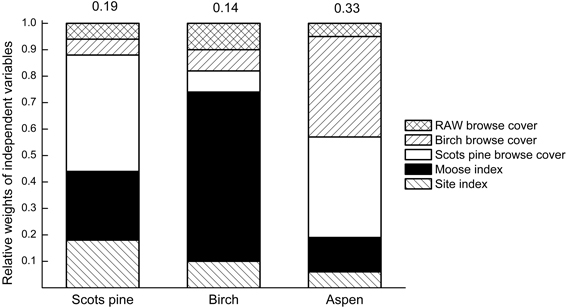
Fig. 2. Akaike relative weights for independent variables (normalized to sum up to 1.0 for each species) in multiple regressions explaining recent browsing damage by moose to Scots pine, birch and aspen. The proportion of the total variance explained by all variables combined (Adj. R2) are given above each bar. RAW = rowan, aspen, willows.
| Table 2. Summary of regression models used to explain recent moose damage to Scots pine, birch and aspen at the tract level. All independent variables except site index were [log10 (n + 1)] transformed before analysis. | ||||
| Variables | df | Coeff. | SE | p |
| Scots pine | ||||
| Intercept | 1 | –0.314 | 0.461 | 0.497 |
| Moose index | 1 | 1.068 | 0.328 | 0.001 |
| Site index | 1 | 0.042 | 0.018 | 0.025 |
| Scots pine cover | 1 | –0.461 | 0.116 | <0.001 |
| Birch cover | 1 | 0.005 | 0.146 | 0.970 |
| RAW cover | 1 | 0.100 | 0.202 | 0.621 |
| Error | 167 | |||
| Total | 173 | |||
| F | 8.735 | <0.001 | ||
| Birch | ||||
| Intercept | 1 | –0.400 | 0.588 | 0.497 |
| Moose index | 1 | 1.793 | 0.410 | <0.001 |
| Site index | 1 | 0.038 | 0.023 | 0.100 |
| Scots pine cover | 1 | 0.135 | 0.144 | 0.351 |
| Birch cover | 1 | –0.158 | 0.198 | 0.424 |
| RAW cover | 1 | –0.295 | 0.243 | 0.226 |
| Error | 162 | |||
| Total | 168 | |||
| F | 6.550 | <0.001 | ||
| Aspen | ||||
| Intercept | 1 | 4.178 | 1.963 | 0.042 |
| Moose index | 1 | 1.503 | 1.277 | 0.249 |
| Site index | 1 | –0.058 | 0.068 | 0.408 |
| Scots pine cover | 1 | –1.513 | 0.546 | 0.010 |
| Birch cover | 1 | –1.715 | 0.592 | 0.007 |
| RAW cover | 1 | 0.272 | 0.707 | 0.703 |
| Error | 26 | |||
| Total | 32 | |||
| F | 3.785 | 0.010 | ||
| Note: RAW = rowan, aspen, willows | ||||
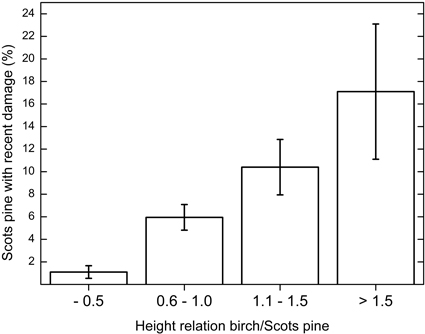
Fig. 3. Proportion of Scots pine with recent browsing damage depending on the height-relation between birch and Scots pine. When the relation is >1.0, birch is overtopping pine. Tracts with both birch and Scots pine are included in the analysis (n = 154). Vertical bars show ± one S.E. of the mean.
| Table 3. Independent variables included and ΔAICc values for predicting recent moose browsing damage on Scots pine, birch and aspen. | ||||||
| Species | Moose index | Site index | Forage cover | ΔAICc | ||
| Scots pine | Birch | RAW | ||||
| Scots pine | X | X | X | 0 | ||
| X | X | X | X | 1.72 | ||
| X | X | X | X | X | 3.72 | |
| Birch | X | 0 | ||||
| X | X | 0.61 | ||||
| X | X | X | 0.75 | |||
| X | X | X | X | 2.24 | ||
| X | X | X | X | X | 3.57 | |
| Aspen | X | X | 0 | |||
| X | X | X | 0.94 | |||
| X | X | X | X | 2.10 | ||
| X | X | X | X | X | 3.92 | |
| Note: RAW = rowan, aspen, willows | ||||||