| Table 1. Mean and sdev (standard deviation, in parentheses) of stem diameter (d1.3), height (h), crown diameter (dcr), and age. | |||
| Variable | Pine N = 5914 | Spruce N = 7105 | Birch N = 2169 |
| d1.3, cm | 20.1 (6.5) | 20.3 (7.9) | 15.1 (6.7) |
| h, m | 17.5 (4.1) | 18.1 (5.8) | 16.4 (5.3) |
| dcr, m | 2.8 (0.9) | 2.9 (0.9) | 2.6 (0.9) |
| Age, years | 59.5 (25.3) | 66.4 (28.7) | 47.0 (24.6) |
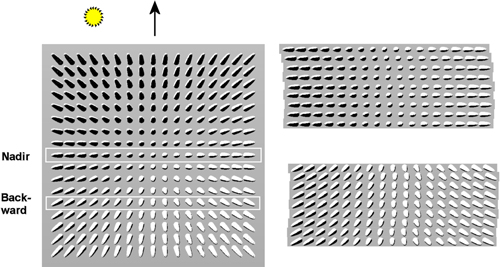
Fig. 1. Illustration of perspective imaging of a ‘forest scene’. A frame camera image on the left has white rectangles depicting the nadir- and backward viewing lines of the ADS40. Sections of the nadir (N00) and backward viewing (B16) images are shown on the right. The flying direction is upwards and it is 25° off with respect to the direction to the Sun.
| Table 2. Characteristics of the ADS40 data acquisition by each four-color image. ‘Trees lost’ is the percentage of trees occluded or shaded by clouds in the image coverage. | ||||||||
| Flying altitude [km] | Start time [GMT] | Flight path azimuth [°] | Sun azimuth [°] | Sun elevation [°] | Tree observations | Trees lost [%] | Integration time [ms] | Active CCD lines |
| 1 | 0656 | 349 | 119.3 | 27.1 | 48 | - | 1.94 | N00 |
| 1 | 0703 | 169 | 121.0 | 27.8 | 6345 | 8 | 1.94 | N00 |
| 1 | 0711 | 349 | 123.1 | 28.6 | 9027 | 24 | 1.94 | N00 |
| 1 | 0718 | 169 | 124.9 | 29.3 | - | - | 1.94 | N00 |
| 1 | 0725 | 349 | 126.7 | 30.0 | 6867 | - | 1.94 | N00 |
| 1 | 0733 | 169 | 128.8 | 30.7 | 6917 | - | 1.94 | B16 |
| 2 | 0745 | 349 | 132.0 | 31.8 | 8844 | 3 | 2.77 | N00 |
| 2 | 0753 | 169 | 134.2 | 32.5 | 11332 | 8 | 2.77 | N00 |
| 2 | 0800 | 349 | 136.1 | 33.1 | 7550 | 17 | 2.77 | B16 |
| 2 | 0808 | 169 | 138.3 | 33.7 | 11077 | 5 | 2.77 | B16 |
| 3 | 0818 | 349 | 141.1 | 34.4 | 13571 | 2 | 4.16 | N00 |
| 3 | 0818 | 349 | 141.1 | 34.4 | 14876 | 0 | 4.16 | B16 |
| 3 | 0825 | 169 | 143.1 | 35.0 | 12045 | 16 | 4.16 | N00 |
| 3 | 0825 | 169 | 143.1 | 35.0 | 11280 | 8 | 4.16 | B16 |
| 3 | 0833 | 260 | 145.4 | 35.5 | 8742 | 28 | 4.16 | N00 |
| 3 | 0833 | 260 | 145.4 | 35.5 | 9694 | 35 | 4.16 | B16 |
| 4 | 0843 | 169 | 148.3 | 36.1 | 13531 | 4 | 5.54 | N00 |
| 4 | 0843 | 169 | 148.3 | 36.1 | 12073 | 0 | 5.54 | B16 |
| 4 | 0852 | 260 | 151.0 | 36.7 | 12352 | 6 | 5.54 | N00 |
| 4 | 0852 | 260 | 151.0 | 36.7 | 12941 | 11 | 5.54 | B16 |
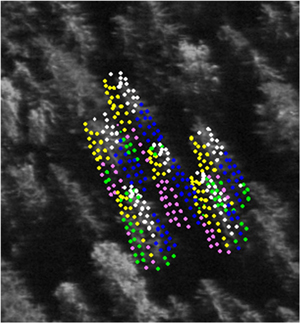
Fig. 2. Illustration of sidelit spruce crowns that were sampled for image data in a 1-km B16 BLU image. Points not self-occluded were superimposed. Colors depict the assigned illumination class: white = sunlit (Su), yellow = self-shaded (Se), blue = neighbor-shaded, magenta = neighbor- and self-shaded. Green points are occluded by a neighboring tree.
| Table 3. Mean reflectance factors of pine, spruce and birch crowns at nadir. BLU (blue), GRN (green), RED (red), NIR (near-infrared). Se = self-shaded, Su = sunlit illumination class. | ||||
| Illumination – Species | BLU | GRN | RED | NIR |
| Se – Pine | 0.037 | 0.041 | 0.030 | 0.169 |
| Se – Spruce | 0.035 | 0.035 | 0.024 | 0.155 |
| Se – Birch | 0.038 | 0.044 | 0.031 | 0.227 |
| Su – Pine | 0.040 | 0.051 | 0.037 | 0.220 |
| Su – Spruce | 0.038 | 0.047 | 0.032 | 0.224 |
| Su – Birch | 0.042 | 0.060 | 0.043 | 0.322 |
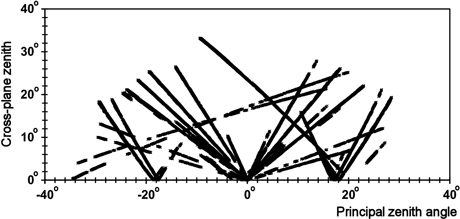
Fig. 3. Distribution of all image observations in the xy view-illumination geometry (Eq. 1). The x coordinate is negative in the forward-scattering geometry (back-lit trees dominate) and positive in the backscattering geometry, in which front-lit trees dominate the view.
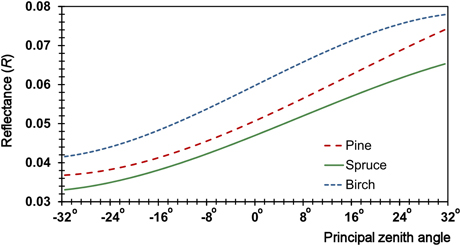
Fig. 4. Examples of directional R anisotropy models for the GRN band in the Su illumination class showing the response along the solar principal plane (y = 0°). The principal plane (view) zenith angle ranges from –32° (forward scattering) to +32 (backscattering), i.e. from back-lit to front-lit trees. The R of pine deviates somewhat from spruce and birch as a function of the view zenith angle, which constitutes the directional ‘signature’.
| Table 4. Partition of reflectance factor (R) variance between the terms of the mixed-effects models (Eq. 3). Percentages (%) of total R variance. Su refers to the directly illuminated canopy and Se to self-shaded canopy in diffuse illumination. BLU (blue), GRN (green), RED (red), NIR (near-infrared). | ||||||||
| Band | BLU | GRN | RED | NIR | ||||
| Illumination | Su | Se | Su | Se | Su | Se | Su | Se |
| Directional anisotropy | ||||||||
| Pine | 51 | 36 | 41 | 19 | 42 | 15 | 4 | 1 |
| Spruce | 43 | 21 | 36 | 10 | 37 | 10 | 13 | 0 |
| Birch | 41 | 29 | 20 | 9 | 18 | 8 | 4 | 0 |
| Mean | 45 | 29 | 32 | 13 | 33 | 11 | 7 | 0 |
| Tree effect | ||||||||
| Pine | 13 | 12 | 35 | 38 | 35 | 41 | 58 | 60 |
| Spruce | 14 | 13 | 39 | 42 | 37 | 42 | 58 | 67 |
| Birch | 26 | 15 | 54 | 44 | 55 | 44 | 70 | 65 |
| Mean | 18 | 13 | 43 | 41 | 42 | 42 | 62 | 64 |
| Image effect | ||||||||
| Pine | 28 | 42 | 6 | 14 | 5 | 11 | 9 | 2 |
| Spruce | 33 | 54 | 5 | 17 | 5 | 15 | 3 | 1 |
| Birch | 20 | 41 | 3 | 10 | 3 | 9 | 6 | 2 |
| Mean | 27 | 46 | 5 | 14 | 4 | 12 | 6 | 2 |
| Residual | ||||||||
| Pine | 8 | 10 | 18 | 29 | 18 | 33 | 29 | 37 |
| Spruce | 10 | 12 | 21 | 30 | 21 | 32 | 26 | 32 |
| Birch | 13 | 15 | 22 | 38 | 23 | 39 | 20 | 33 |
| Mean | 10 | 13 | 20 | 32 | 21 | 35 | 25 | 34 |
| Table 5. Classification performance when the training and validation data were from the same image. The sdevs of the overall accuracy values varied from 0.4 to 0.7% in 100 trials with randomized training data. | ||||||
| Image | Height, km | Accuracy % | Kappa | Pine % | Spruce % | Birch % |
| 0753_N00 | 2 | 78.7 | 0.657 | 80.6 | 78.2 | 75.9 |
| 0808_B16 | 2 | 80.4 | 0.683 | 84.0 | 79.5 | 73.7 |
| 0818_N00 | 3 | 75.6 | 0.604 | 75.5 | 76.4 | 73.5 |
| 0825_N00 | 3 | 74.3 | 0.582 | 75.8 | 74.2 | 70.0 |
| 0833_N00 | 3 | 75.7 | 0.610 | 74.9 | 77.0 | 73.6 |
| 0843_N00 | 4 | 77.8 | 0.641 | 80.7 | 76.9 | 72.8 |
| Table 6. QDA classification performance when the training and validation data were from different 3 km images in the same strip. Tests with nadir normalized (Rnadir, *) data are included. | ||||||
| Training | Validation | Accuracy % | Kappa | Pine | Spruce | Birch |
| 0818_B16 | 0818_N00 | 66.3 | 0.480 | 73.6 | 56.7 | 77.2 |
| * | * | 69.6 | 0.510 | 64.6 | 74.2 | 68.3 |
| 0825_B16 | 0825_N00 | 62.8 | 0.386 | 38.6 | 83.7 | 66.5 |
| * | * | 58.2 | 0.341 | 58.9 | 54.0 | 70.4 |
| 0833_B16 | 0833_N00 | 72.5 | 0.575 | 80.4 | 64.8 | 78.6 |
| * | * | 70.4 | 0.540 | 75.6 | 65.4 | 74.5 |
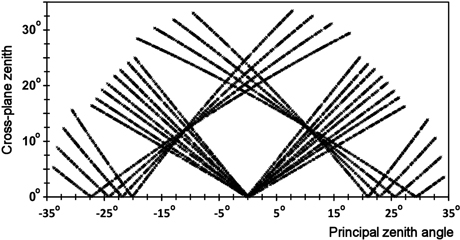
Fig. 5. xy observation geometry (Eq. 1) of eight N⇔S-oriented strips and 16 images. ϕSun changed from 140 to 161° with 3° intervals. The V- and L-shaped patterns represent observations in the nadir and backward viewing images, respectively.
| Table 7. Sdevs of the parameters of the reflectance calibration error functions (Eq. 5, parameters a0, a1, a2). Plausible and accurate level of errors. x ∈ [–0.6, 0.6] and y ∈ [0, 0.6] in radians. BLU (blue), GRN (green), RED (red), NIR (near-infrared). | ||||
| BLU | GRN | RED | NIR | |
| a0 | 0.20 | 0.10 | 0.10 | 0.075 |
| a1 | 0.05 | 0.025 | 0.025 | 0.020 |
| a2 | 0.025 | 0.0125 | 0.0125 | 0.010 |
| a0 | 0.05 | 0.03 | 0.02 | 0.02 |
| a1 | 0.01 | 0.005 | 0.005 | 0.005 |
| a2 | 0.005 | 0.005 | 0.005 | 0.0025 |
| Table 8. Classification performance in simulations using plausible and very accurate R calibration accuracy and directional signatures. Simulated strips were flown in N⇔S direction. Values in parentheses are CVs (%). Strip overlaps were 35% or 67% and the mean ϕSun were 90°, 135° or 180° resulting in six view-illumination geometry scenarios. In each scenario, the first line shows the results for all trees (2.9 or 4.7 image observations per tree), while the next lines show the results for trees observed in 2, 4 or 6 images. | ||||||||||
| N | Plausible reflectance calibration accuracy | Very accurate reflectance calibration | ||||||||
| Accuracy | Kappa | Pine | Spruce | Birch | Accuracy | Kappa | Pine | Spruce | Birch | |
| a) 35% overlap, solar azimuth 90 (strong directional effects) | ||||||||||
| 2.9 | 79 (5) | 0.68 (8) | 82 (11) | 77 (11) | 77 (10) | 83 (1) | 0.74 (2) | 87 (3) | 80 (4) | 80 (3) |
| 2 | 69 (6) | 0.53 (11) | 72 (22) | 67 (23) | 68 (12) | 74 (2) | 0.60 (4) | 80 (6) | 69 (9) | 72 (5) |
| 4 | 91 (5) | 0.87 (7) | 95 (4) | 90 (6) | 89 (9) | 94 (1) | 0.91 (2) | 97 (2) | 94 (2) | 91 (2) |
| b) 67% overlap, solar azimuth 90° | ||||||||||
| 4.7 | 87 (4) | 0.80 (7) | 91 (7) | 86 (7) | 84 (9) | 89 (1) | 0.84 (2) | 93 (2) | 88 (3) | 87 (3) |
| 2 | 79 (9) | 0.68 (15) | 82 (15) | 77 (17) | 77 (15) | 83 (4) | 0.75 (7) | 89 (6) | 79 (9) | 82 (8) |
| 4 | 80 (7) | 0.71 (12) | 84 (16) | 78 (16) | 79 (13) | 84 (4) | 0.76 (7) | 89 (6) | 82 (9) | 82 (8) |
| 6 | 91 (3) | 0.87 (5) | 95 (4) | 91 (5) | 88 (8) | 93 (1) | 0.89 (2) | 96 (2) | 93 (3) | 90 (3) |
| c) 35% overlap, solar azimuth 135 (intermediate directional effects) | ||||||||||
| 2.9 | 78 (6) | 0.67 (11) | 82 (14) | 76 (13) | 76 (10) | 83 (1) | 0.74 (2) | 88 (3) | 80 (4) | 80 (3) |
| 2 | 69 (7) | 0.54 (14) | 74 (20) | 66 (21) | 68 (13) | 74 (2) | 0.62 (4) | 81 (5) | 70 (8) | 72 (5) |
| 4 | 89 (6) | 0.84 (9) | 92 (10) | 88 (7) | 87 (8) | 94 (1) | 0.90 (2) | 96 (2) | 94 (2) | 91 (3) |
| d) 67% overlap, solar azimuth 135° | ||||||||||
| 4.7 | 84 (4) | 0.77 (7) | 89 (11) | 82 (12) | 82 (9) | 89 (2) | 0.83 (2) | 93 (3) | 87 (4) | 86 (4) |
| 2 | 71 (11) | 0.57 (22) | 77 (33) | 67 (37) | 71 (17) | 80 (5) | 0.70 (8) | 86 (10) | 77 (11) | 76 (8) |
| 4 | 83 (6) | 0.74 (10) | 87 (11) | 80 (14) | 81 (13) | 87 (4) | 0.80 (6) | 92 (5) | 84 (8) | 84 (7) |
| 6 | 89 (4) | 0.84 (6) | 93 (8) | 88 (9) | 87 (8) | 92 (2) | 0.88 (2) | 96 (2) | 92 (3) | 89 (4) |
| e) 35% overlap, solar azimuth 180° (mild directional effects) | ||||||||||
| 2.9 | 75 (10) | 0.62 (18) | 78 (24) | 72 (21) | 74 (10) | 83 (2) | 0.75 (3) | 89 (4) | 82 (5) | 79 (3) |
| 2 | 70 (9) | 0.55 (16) | 75 (18) | 65 (18) | 69 (12) | 77 (2) | 0.65 (4) | 84 (5) | 74 (7) | 73 (5) |
| 4 | 81 (13) | 0.71 (22) | 81 (33) | 81 (26) | 81 (11) | 91 (2) | 0.87 (3) | 95 (4) | 92 (4) | 86 (3) |
| f) 67% overlap, solar azimuth 180° | ||||||||||
| 4.7 | 77 (11) | 0.66 (20) | 78 (35) | 78 (23) | 76 (10) | 87 (2) | 0.80 (3) | 92 (5) | 86 (5) | 82 (3) |
| 2 | 68 (16) | 0.52 (31) | 71 (44) | 67 (40) | 69 (20) | 81 (4) | 0.71 (7) | 87 (10) | 78 (12) | 77 (8) |
| 4 | 76 (10) | 0.64 (18) | 79 (31) | 76 (24) | 73 (14) | 84 (4) | 0.76 (7) | 91 (7) | 83 (9) | 79 (9) |
| 6 | 81 (12) | 0.71 (20) | 80 (34) | 82 (21) | 80 (9) | 89 (2) | 0.84 (3) | 95 (4) | 89 (5) | 84 (4) |
| Table 9. QDA classification performance in simulations using averaged R features and the same simulated data (a through f) as in Table 8. Values in parentheses are CVs (%). Plausible (Pl) and accurate (vA) reflectance calibration accuracy. Strip overlaps (O-%) were 35% or 67%, giving on average 2.9 or 4.7 image observations per tree. | ||||||||
| Case | Overlap, % | mean ϕsun | R calibration | Accuracy | Kappa | Pine | Spruce | Birch |
| a | 35 | 90° | Pl | 78.5 (1.0) | 0.677 (1.7) | 84.6 (2) | 74.8 (3) | 76.1 (2) |
| vA | 79.5 (0.8) | 0.693 (1.4) | 84.5 (2) | 76.1 (2) | 77.9 (2) | |||
| b | 67 | 90° | Pl | 82.7 (1.1) | 0.741 (1.9) | 88.3 (2) | 79.7 (3) | 80.1 (2) |
| vA | 83.1 (0.8) | 0.747 (1.4) | 88.5 (2) | 80.5 (3) | 80.5 (2) | |||
| c | 35 | 135° | Pl | 79.1 (0.9) | 0.686 (1.6) | 83.7 (2) | 75.4 (3) | 78.2 (2) |
| vA | 80.2 (0.8) | 0.703 (1.3) | 84.0 (2) | 76.6 (2) | 79.9 (2) | |||
| d | 67 | 135° | Pl | 83.3 (1.2) | 0.749 (1.9) | 86.9 (2) | 80.2 (2) | 82.7 (2) |
| vA | 84.3 (0.8) | 0.764 (1.3) | 87.2 (2) | 81.7 (2) | 83.9 (2) | |||
| e | 35 | 180° | Pl | 82.1 (1.1) | 0.732 (1.9) | 84.4 (2) | 79.0 (2) | 83.0 (2) |
| vA | 83.5 (0.8) | 0.753 (1.4) | 85.3 (2) | 80.3 (2) | 84.9 (2) | |||
| f | 67 | 180° | Pl | 85.4 (1.2) | 0.781 (2.0) | 87.7 (2) | 82.4 (2) | 86.1 (2) |
| vA | 86.5 (0.8) | 0.797 (1.4) | 88.5 (2) | 83.6 (2) | 87.3 (1) | |||