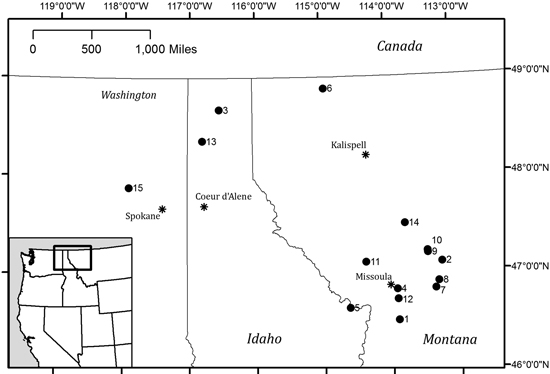
Fig. 1. Study sites across eastern WA, northern ID and western MT. Numeric labels correspond to site details in Table 1.
| Table 1. Study site information: name, sampled species, DBH range of sampled trees, basal area range as taken using the sample tree as plot center, and site elevation. Bracketed numbers indicate the number of each species sampled at each location. | ||||
| Site | Species sampled | DBH range (cm) | Basal area range (m2 ha–1) | Elevation (m) |
| 1. Ambrose Saddle | P. menziesii [3] P. ponderosa [1] A. lasiocarpa [6] | 49.4–60.0 63.6 11.5–62.7 | 9.2–16.1 2.3 34.4–68.9 | 1800 |
| 2. Bandy | P. menziesii [1] P. ponderosa [1] A. lasiocarpa [3] | 41.4 27.3 18.3–22.0 | 34.4 9.2 18.4–34.4 | 1350 |
| 3. Bonner’s Ferry | P. ponderosa [1] A. lasiocarpa [12] | 19.2 5.8–42.2 | 4.6 11.5–41.3 | 1500 |
| 4. Deer Creek | P. ponderosa [8] | 17.5–80.2 | 6.9–25.3 | 1300 |
| 5. Granite Pass | A. lasiocarpa [4] | 7.0–25.0 | not available | 1900 |
| 6. Kootenai | P. menziesii [4] P. ponderosa [4] | 16.4–30.2 17.4–62.9 | 6.9–18.4 9.2–36.7 | 1000 |
| 7. Lubrecht Garnet | P. menziesii [4] P. ponderosa [2] | 29.4–50.9 59.5–63.2 | 9.2–16.1 9.2–13.8 | 1850 |
| 8. Lubrecht Section 1 | A. lasiocarpa [1] | 14.2 | 9.2 | 1900 |
| 9. Lubrecht Stinkwater | A. lasiocarpa [1] | 37.0 | not available | 1550 |
| 10. Morrell Creek | P. menziesii [4] P. ponderosa [5] | 21.9–38.4 16.8–44.0 | 4.6–16.1 2.3–13.8 | 1350 |
| 11. Nine Mile | P. menziesii [6] P. ponderosa [5] | 10.1–47.9 14.0–64.8 | 9.2–27.5 9.2–20.7 | 1400 |
| 12. Plant Creek | P. menziesii [3] | 37.2–48.5 | 6.9 | 1300 |
| 13. Priest River | P. ponderosa [2] | 57.2–69.9 | not available | 950 |
| 14. Swan-hemlock | P. menziesii [1] | 45.1 | 23.0 | 1200 |
| 15. Wellpinint - Tomine | P. menziesii [4] | 30.7–62.9 | 6.9–16.1 | 700 |
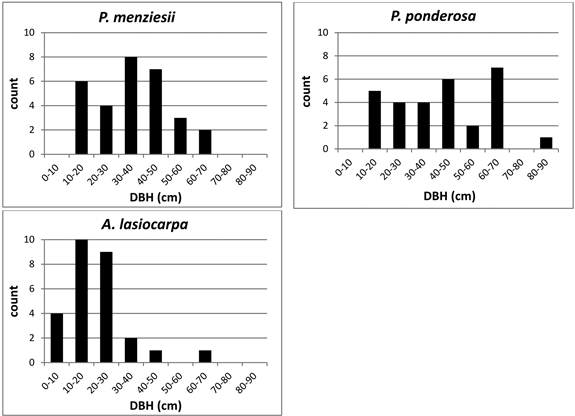
Fig. 2. DBH size class distribution of sample trees by species.
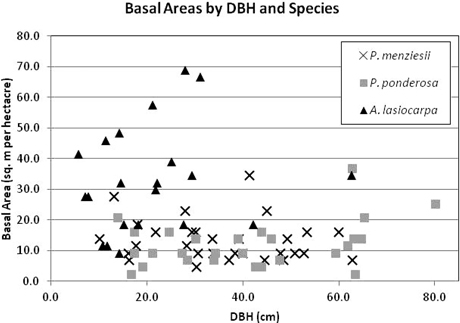
Fig. 3. Stand basal area (BA) by DBH and species of sample trees. BA was calculated using a 10 ft acre–1 factor angle gauge from the sample tree location, and included the sampled tree. Seven sample trees missing BA data not included.
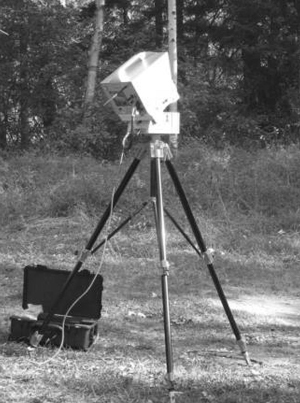
Fig. 4. The laser scan head is mounted on a pan-tilt base permitting bi-directional rotation. It is powered by a battery pack and scanning is controlled remotely through a hand-held device. Data is written to a USB-port on the rear panel of the scan head.
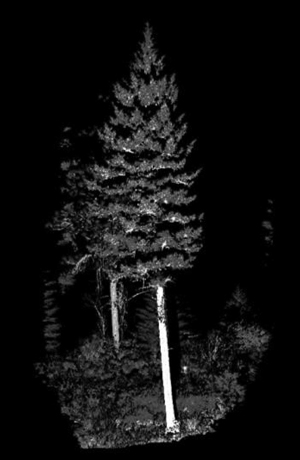
Fig. 5. An original single (unmerged) tree scan as initially visualized. Note that the sample tree in the foreground will be isolated by removing returns from other vegetation in the scene.
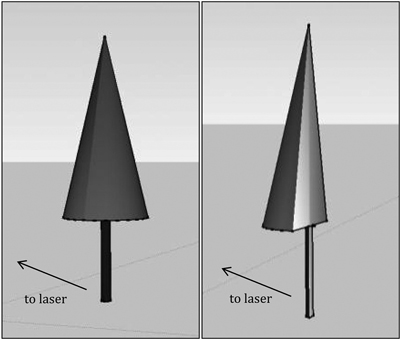
Fig. 6. Hypothetical extent of the original point cloud (left) and hemisphere of the tree closest to the scanner, after isolation.
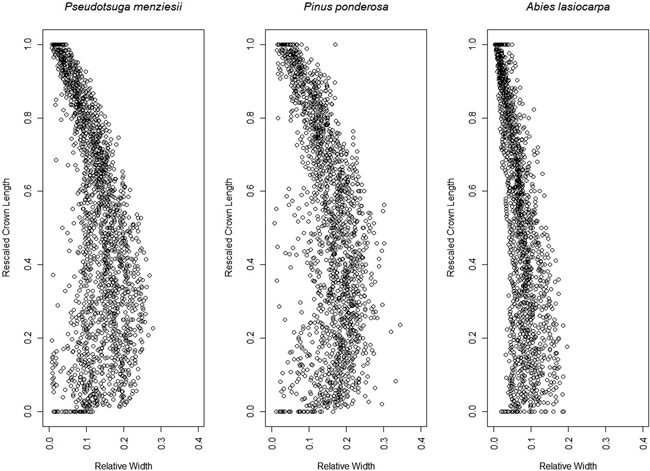
Fig. 7. Aggregate 95th width percentile points for each species, after rescaling crown length 0–1 and the crown width relative to the crown length.
| Table 2. Equation parameters for the aggregate 95th percentile points of each species. | ||
| Species | Beta | Weibull |
| P. menziesii | a = 1.2405 b = 1.5580 c = 0.1286 | a = 1.4043 b = 0.6610 c = 0.1540 |
| P. ponderosa | a = 1.1821 b = 1.4627 c = 0.1528 | a = 1.3266 b = 0.7241 c = 0.1943 |
| A. lasiocarpa | a = 1.1250 b = 1.6973 c = 0.0718 | a = 1.2677 b = 0.5780 c = 0.0832 |
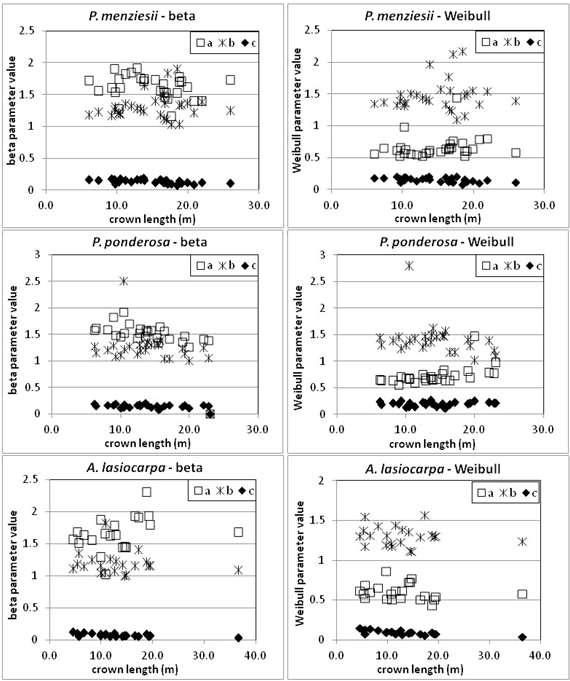
Fig. 8. Parameters for Weibull and beta curves of individual trees related to crown length. Note variations in axes among plots.
| Table 3. Each equation parameter (a, b, c for both beta and Weibull curves) was plotted against the structure and environmental variables of crown length, DBH and basal area. The table below reports the slope of the fitted linear regression and, in parentheses, two standard errors of the slope. | ||||||
| Beta parameters | Weibull parameters | |||||
| a | b | c | a | b | c | |
| P. menziesii | ||||||
| Crown length | –0.009 (0.014) | 0.007 (0.016) | –0.004 (0.002) | 0.007 (0.014) | 0.008 (0.020) | –0.004 (0.002) |
| DBH | 0.000 (0.004) | 0.002 (0.005) | 0.000 (0.001) | 0.000 (0.005) | 0.002 (0.007) | –0.001 (0.001) |
| Basal area | 0.002 (0.010) | –0.002 (0.011) | 0.001 (0.002) | –0.000 (0.010) | –0.004 (0.014) | 0.001 (0.002) |
| A. lasiocarpa | ||||||
| Crown length | 0.012 (0.017) | –0.003 (0.011) | –0.002 (0.001) | –0.003 (0.007) | –0.004 (0.008) | –0.003 (0.001) |
| DBH | 0.005 (0.008) | –0.001 (0.006) | –0.001 (0.001) | –0.001 (0.003) | –0.002 (0.004) | –0.001 (0.001) |
| Basal area | –0.004 (0.007) | –0.002 (0.005) | –0.001 (0.001) | 0.003 (0.002) | 0.000 (0.003) | 0.000 (0.001) |
| P. ponderosa | ||||||
| Crown length | –0.019 (0.011) | –0.013 (0.024) | –0.002 (0.003) | 0.018 (0.013) | –0.017 (0.027) | 0.001 (0.004) |
| DBH | –0.004 (0.003) | –0.002 (0.006) | 0.000 (0.001) | 0.002 (0.003) | –0.003 (0.006) | 0.000 (0.001) |
| Basal area | –0.019 (0.013) | –0.011 (0.028) | 0.001 (0.003) | 0.013 (0.016) | –0.014 (0.031) | 0.003 (0.004) |
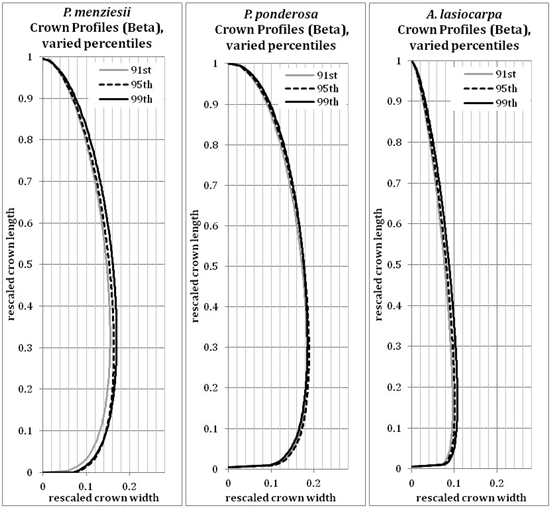
Fig. 9. Beta (modified) curves modeled on the 91st, 95th or 99th width percentile points for each species. Because the axes have been rescaled, they are considered unitless.
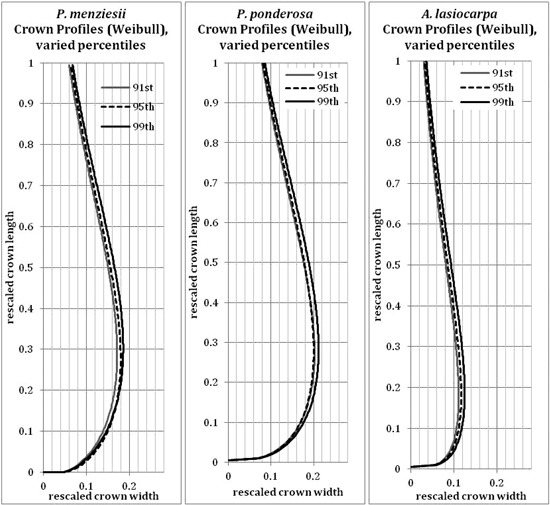
Fig. 10. Weibull (modified) curves modeled on the 91st, 95th or 99th width percentile points for each species. Because the axes have been rescaled, they are considered unitless.
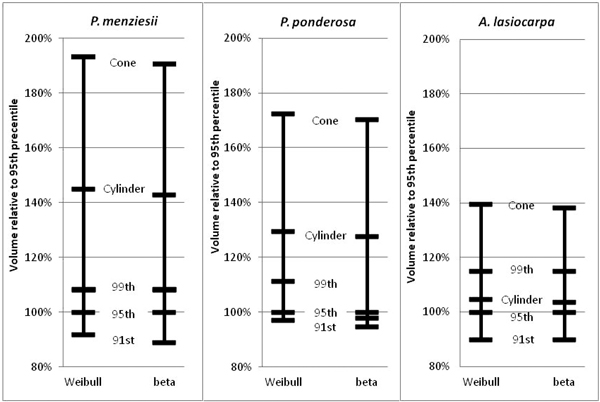
Fig. 11. Relative volume comparisons. For each species, beta and Weibull curves modeled on the 95th width percentiles were used to calculate “base” volumes. Then, volumes calculated from the 91st and 99th width percentile profile curves, and the modeled cones and cylinders for each species were compared to the base cases.
| Table 4. Mean absolute error (MAE) for predictions made by the beta curve of a species for the 95th width percentile points of each tree. P-values were calculated in R. | |||||
| Beta MAE | Modeled curve predictor species/shape | ||||
| Reference species 95th width percentile points | P. menziesii | P. ponderosa | A. lasiocarpa | Cone | Cylinder |
| P. menziesii | 0.034 p = na | 0.039 p<0.001 | 0.062 p<0.001 | 0.066 p<0.001 | 0.054 p<0.001 |
| P. ponderosa | 0.041 p<0.001 | 0.035 p = na | 0.084 p<0.001 | 0.075 p<0.001 | 0.052 p<0.001 |
| A. lasiocarpa | 0.059 p<0.001 | 0.082 p<0.001 | 0.022 p = na | 0.027 p<0.001 | 0.031 p<0.001 |
| Table 5. Mean absolute error (MAE) for predictions made by the Weibull curve of a species for the 95th width percentile points of each tree. P-values were calculated in R. | |||||
| Weibull MAE | Modeled curve predictor species/shape | ||||
| Reference species 95th width percentile points | P. menziesii | P. ponderosa | A. lasiocarpa | Cone | Cylinder |
| P. menziesii | 0.036 p = na | 0.040 p<0.001 | 0.062 p<0.001 | 0.066 p<0.001 | 0.054 p<0.001 |
| P. ponderosa | 0.043 p<0.001 | 0.037 p = na | 0.083 p<0.001 | 0.075 p<0.001 | 0.052 p<0.001 |
| A. lasiocarpa | 0.059 p<0.001 | 0.082 p<0.001 | 0.023 p = na | 0.027 p<0.001 | 0.031 p<0.001 |
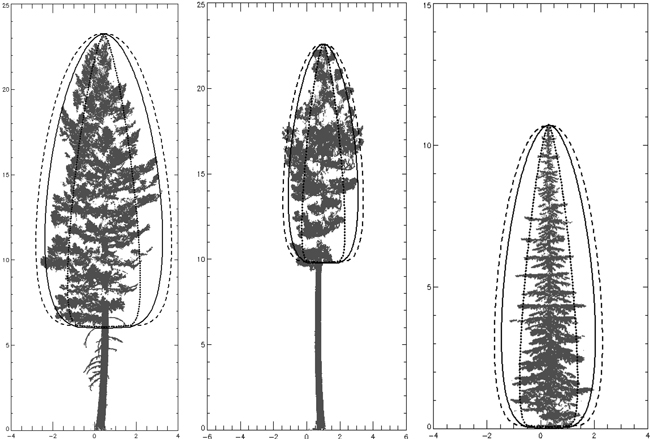
Fig. 12. Three species beta curves on one tree of each species (height and width expressed in meters). L to R – P. menziesii, P. ponderosa, A. lasiocarpa. P. menziesii curve is solid line, P. ponderosa curve is dashed line and A. lasiocarpa curve is dotted line. Each curve was generated using species’ parameters with crown length for the individual trees pictured.
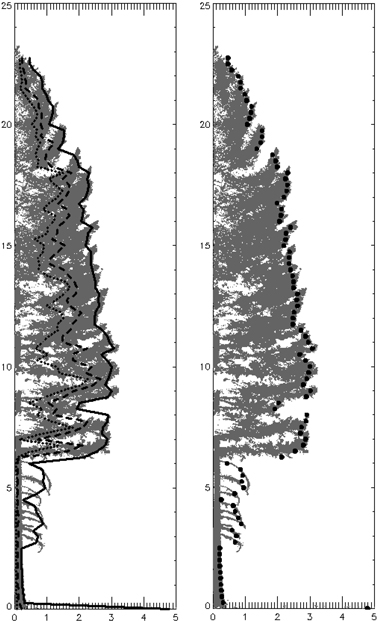
Fig. 13. Folded P. menziesii with 25th (dotted), 50th (dashed) and 95th (solid) width percentiles. Right image shows 95th percentile displayed as points (at the 0.25 m height increment bins).