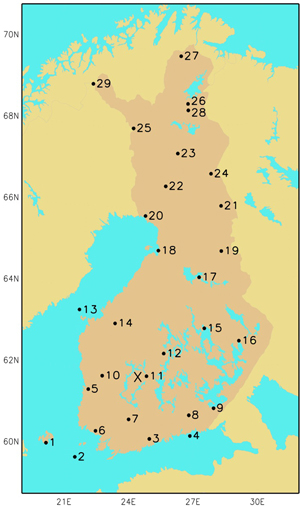
Fig. 1. Locations of the stations involved in this study. More information about the stations is presented in Table 1. The location of the Hyytiälä forestry field station is marked with a cross.
| Table 1. Stations involved in this study along with their altitude above sea level and the geographical coordinates. The periods that have been excluded from the analyses because of missing data are listed as well. More information about the changes in measurement sites and data deficiencies are mentioned in the footnotes. | |||||
| No. | Station | Alt. (m) | Lat. (°N) | Lon. (°E) | Missing data |
| 1 | Mariehamn 1) | 5 | 60.12 | 19.90 | |
| 2 | Utö | 9 | 59.78 | 21.37 | |
| 3 | Vantaa | 51 | 60.33 | 24.96 | |
| 4 | Rankki 2) | 11 | 60.38 | 26.96 | Oct 2006 |
| 5 | Pori 3) | 13 | 61.47 | 21.79 | |
| 6 | Turku 4) | 49 | 60.52 | 22.27 | |
| 7 | Jokioinen | 104 | 60.81 | 23.50 | |
| 8 | Utti 5) | 99 | 60.89 | 26.94 | Dec 2010 |
| 9 | Lappeenranta 6) | 106 | 61.04 | 28.15 | Jul 2006 – Jun 2008 |
| 10 | Niinisalo | 124 | 61.84 | 22.46 | |
| 11 | Halli 7) | 145 | 61.86 | 24.79 | Jan 1961 – Dec 1964 |
| 12 | Jyväskylä | 139 | 62.40 | 25.68 | |
| 13 | Valsörarna | 4 | 63.44 | 21.06 | Jan 2009 – Dec 2010 |
| 14 | Kauhava 8) | 42 | 63.12 | 23.04 | |
| 15 | Kuopio 9) | 99 | 63.01 | 27.80 | |
| 16 | Joensuu 10) | 121 | 62.66 | 29.61 | |
| 17 | Kajaani 11) | 147 | 64.28 | 27.67 | |
| 18 | Oulu 12) | 14 | 64.93 | 25.35 | |
| 19 | Suomussalmi 13) | 220 | 64.90 | 29.01 | Jan 1961 – Aug 1970 |
| 20 | Kemi 14) | 19 | 65.78 | 24.58 | Jun 1995 – Nov 1999 |
| 21 | Kuusamo 15) | 264 | 66.00 | 29.22 | |
| 22 | Rovaniemi | 195 | 66.56 | 25.83 | |
| 23 | Sodankylä | 179 | 67.37 | 26.63 | |
| 24 | Salla 16) | 221 | 66.82 | 28.67 | |
| 25 | Alamuonio 17) | 252 | 67.97 | 23.67 | Nov 1982 – Jan 1983 |
| 26 | Ivalo 18) | 147 | 68.61 | 27.41 | |
| 27 | Kevo 19) | 107 | 69.76 | 27.01 | Jan 1961 – Dec 1961 |
| 28 | Kaunispää 20) | 430 | 68.43 | 27.44 | Jan 1961 – Oct 1995, Jul 2005 – Oct 2005, May 2008 – Oct 2008 |
| 29 | Kilpisjärvi 21) | 480 | 69.05 | 20.79 | Jan 1961 – Dec 1978 |
| 1) Measurement site for precipitation changed on 1st Oct 1995. All data is missing and replaced with data from a nearby station between 1st Oct 1995 and 3rd Sep 1999, 19th Dec 2003 and 5th Jan 2004, 31st Mar and 18th Jul 2005, 29th Dec 2008 and 7th Jan 2009, and 20th and 23rd Mar 2009. Most of these replacement time series have only four or three observations per day, depending on the variable. 2) Measurement site for precipitation changed on 1st Nov 2006. 3) Measurement site for precipitation changed on 1st Jan 2000 and 1st Jan 2010. 4) Measurement site for precipitation changed on 1st Jul 2006. 5) Measurement site for precipitation changed on 1st Jul 2009. 6) Measurement site for precipitation changed on 13th Jun 2008. All data is missing and replaced with data from a nearby station between 1st Oct 1995 and 27th Jun 1996. From 28th Jun 1996 until 29th Oct 1998 21 and 00 UTC observations are missing. 7) Measurement site for precipitation changed on 17th Jun 2009. 8) Measurement site for precipitation changed on 16th Nov 2009. 9) Measurement site for precipitation changed on 1st Jan 2005 and 1st Jan 2006. 10) Measurement site for precipitation changed on 1st Jan 2000. From 1st Jul 1996 until 28th Feb 1998 21 and 00 UTC observations are missing and from 1st Mar 1998 until 2nd Nov 1998 21, 00 and 03 UTC observations are missing. 11) Measurement site for precipitation changed on 1st Aug 2000. 12) Measurement site for precipitation changed on 1st Jun 2000, 1st Jul 2006 and 1st Jan 2008. 13) Measurement site for all variables changed on 1st Nov 2000. Relative humidity measurements are missing from 24th Oct 2005 until 1st Feb 2006. 14) Measurement site for precipitation changed on 1st Jun 1995 and 2nd Sep 2009. 15) Measurement site for precipitation changed on 30th Jun 2000. 16) Measurement site for all variables changed on 1st Aug 1999. Wind speed measurements are missing from 1st Jan 1968 until 19th Jan 1968. 17) Wind speed observations are available only four times per day between 1st Jan and 30th April 1961, and 1st Nov 1968 and 31st Jan 1969. 18) Measurement site for precipitation changed on 4th April 2000 and 1st Jan 2007. 19) All observations are available only three times per day in January 1962 and four times per day from 1st Feb 1962 until 31st Dec 1962. 20) Time series is extended to 30th Jun 2013. Precipitation is measured at a nearby station located at an altitude of 302 metres above the mean sea level. 21) Time series is extended to 30th Jun 2013. Until March 1998 most of 21 and 00 UTC observations are missing. | |||||
| Table 2. Proportions of missing data (‰) after gap filling at each station for temperature (T), relative humidity (RH), wind speed (U) and precipitation (P) within the periods included in the analyses. | |||||
| No. | Station | T (‰) | RH (‰) | U (‰) | P (‰) |
| 1 | Mariehamn | 2.9 | 4.2 | 14.0 | 0.0 |
| 2 | Utö | 0.2 | 0.7 | 2.2 | 0.0 |
| 3 | Vantaa | 1.6 | 1.7 | 1.7 | 0.0 |
| 4 | Rankki | 0.0 | 0.0 | 4.8 | 0.0 |
| 5 | Pori | 0.9 | 2.1 | 2.0 | 0.0 |
| 6 | Turku | 0.5 | 0.6 | 0.7 | 0.0 |
| 7 | Jokioinen | 0.0 | 0.1 | 0.6 | 0.0 |
| 8 | Utti | 0.1 | 0.2 | 1.1 | 0.1 |
| 9 | Lappeenranta | 0.7 | 2.4 | 2.4 | 0.0 |
| 10 | Niinisalo | 0.0 | 0.0 | 0.0 | 0.0 |
| 11 | Halli | 0.5 | 1.1 | 0.8 | 0.0 |
| 12 | Jyväskylä | 0.1 | 0.6 | 0.5 | 0.0 |
| 13 | Valsörarna | 0.0 | 1.3 | 2.1 | 0.0 |
| 14 | Kauhava | 0.5 | 0.7 | 1.4 | 0.0 |
| 15 | Kuopio | 0.2 | 1.0 | 1.0 | 0.0 |
| 16 | Joensuu | 0.1 | 1.7 | 1.7 | 0.0 |
| 17 | Kajaani | 0.1 | 1.1 | 1.7 | 0.0 |
| 18 | Oulu | 0.6 | 1.6 | 1.8 | 0.2 |
| 19 | Suomussalmi | 0.2 | 7.4 | 0.8 | 0.0 |
| 20 | Kemi | 2.2 | 3.4 | 3.5 | 0.0 |
| 21 | Kuusamo | 0.3 | 1.3 | 1.6 | 0.0 |
| 22 | Rovaniemi | 0.0 | 0.3 | 0.3 | 0.0 |
| 23 | Sodankylä | 0.0 | 0.9 | 0.8 | 0.0 |
| 24 | Salla | 0.0 | 0.0 | 1.1 | 0.0 |
| 25 | Alamuonio | 0.0 | 3.8 | 3.3 | 0.0 |
| 26 | Ivalo | 0.6 | 1.7 | 1.8 | 0.0 |
| 27 | Kevo | 0.3 | 0.3 | 0.8 | 0.0 |
| 28 | Kaunispää | 37.6 | 25.9 | 40.1 | 2.4 |
| 29 | Kilpisjärvi | 0.0 | 2.2 | 3.1 | 0.0 |
| Table 3. Threshold values of daily mean 2-metre air temperature (Tmean), 2-metre relative humidity (RHmean), 10-metre wind speed (Umean) and total precipitation (Pday) that are used to determine the risk days favourable for heavy snow loading and riming. | |
| Snow-loading | Riming |
| –3.42 °C < Tmean < 1.05 °C | –5.19 °C < Tmean < –0.16 °C |
| RHmean > 89.44% | RHmean > 95.50% |
| 2.07 m s–1 < Umean < 5.63m s–1 | 2.00 m s–1 < Umean < 4.54 m s–1 |
| Pday > 6.41 mm | Pday < 1.11 mm |
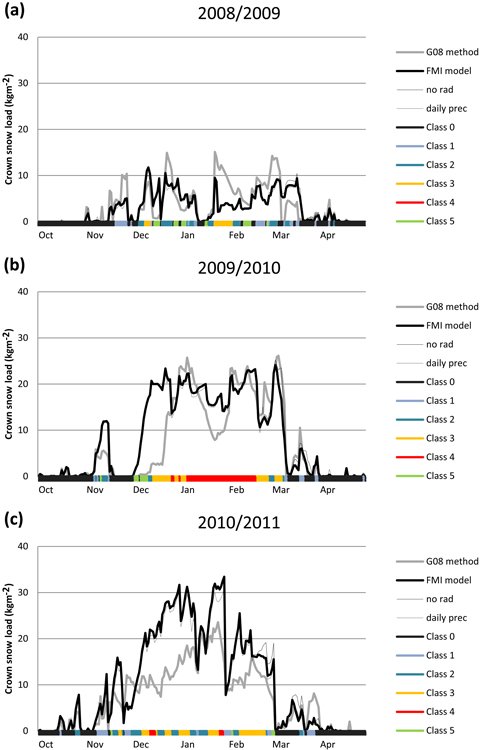
Fig. 2. The daily total crown snow loads (kg m–2) at Hyytiälä on 12 UTC calculated by the G08 method (thick grey line) and the FMI model (thick black line) during the winter (a) 2008/2009, (b) 2009/2010 and (c) 2010/2011. The crown snow loads calculated by the FMI model but excluding the effect of solar radiation (thin solid line) and by using daily precipitation sums instead of hourly sums in the calculations (thin dashed line) are shown as well. The classification of days into six canopy snow classes is presented with colour bars along the x-axis.
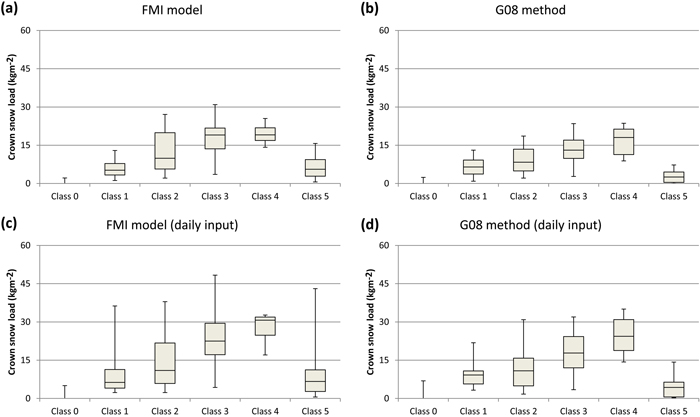
Fig. 3. Box plots showing the distribution of calculated crown snow loads among the different canopy snow classes at Hyytiälä during the period from April 1, 2008 to April 30, 2011. The boxes indicate the central 50% range and the median of the distribution of calculated crown snow loads on days falling into a canopy snow class in question. The whiskers extend to the fifth and 95th percentiles of the distribution. The results are presented for (a) the FMI model and (b) the G08 method. We also show the statistics for the snow loads when daily mean values of all needed input variables are used in the calculations for (c) the FMI model and (d) the G08 method.
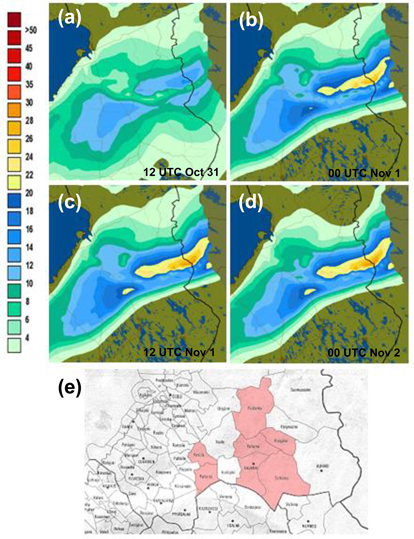
Fig. 4. Total crown snow loads (kg m–2) forecasted by the FMI model for (a) 12 UTC on October 31; (b) 00 UTC on November 1; (c) 12 UTC on November 1; and (d) 00 UTC on November 2 in 2008. The snow loads exceeding 20 kg m–2 are shown with yellowish colours. (e) The municipalities where snow damages caused power cuts are shown in light red.
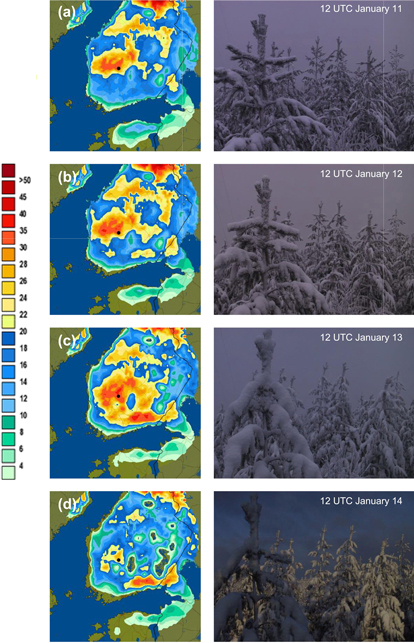
Fig. 5. Total observational crown snow loads (kg m–2) simulated by the FMI model for (a) 12 UTC on January 11; (b) 12 UTC on January 12; (c) 12 UTC on January 13; and (d) 12 UTC on January 14 in 2012. The snow loads exceeding 20 kg m–2 are shown with yellowish colours. Images of canopy snow at Hyytiälä on the corresponding moments are presented as well. The location of Hyytiälä is shown on the maps with a black dot.
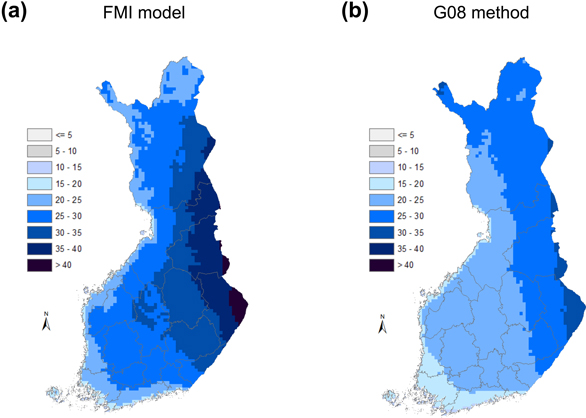
Fig. 6. The spatial distribution of the crown snow-load amount (kg m–2) achieved on average on one day per year within the period 1961–2010 on the basis of (a) the FMI model and (b) the G08 method.
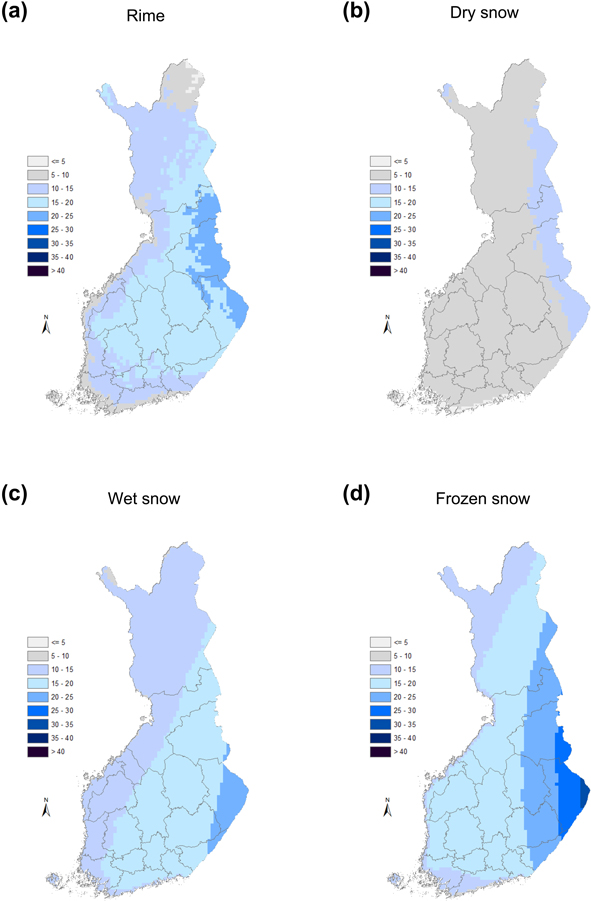
Fig. 7. The spatial distribution of (a) rime; (b) dry snow; (c) wet snow; and (d) frozen snow-load amount (kg m–2) achieved on average on one day per year within the period 1961–2010 on the basis of the FMI model.
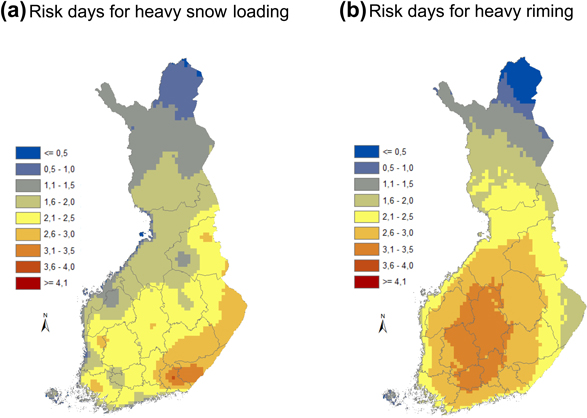
Fig. 8. The annual average count of risk days for (a) heavy snow loading and (b) heavy riming within the period from 1961–2010.
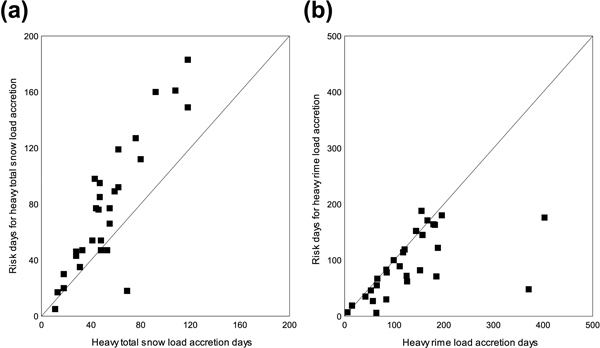
Fig. 9. Number of risk days for (a) heavy total snow-load accretion as a function of the number of days with modelled heavy total snow load accretion; and (b) heavy rime load accretion as a function of the number of days with modelled heavy rime accretion.
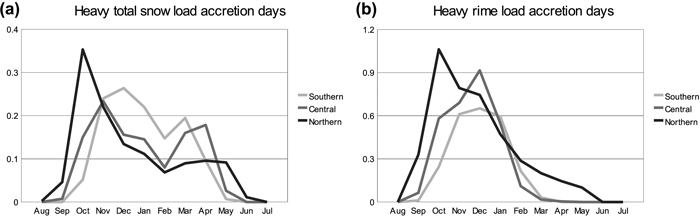
Fig. 10. Annual average number of days by month when (a) the modelled daily maximum total snow load has increased at least 5.35 kg m–2 as compared to the maximum of the previous day; and (b) the modelled daily maximum rime load has increased at least 1.72 kg m–2 as compared to the maximum of the previous day. Statistics are shown separately for southern (stations 1–9), central (stations 10–19) and northern (stations 20–29) Finland.
| Table 4. Correlation coefficients between the annual November–March mean temperature (T), relative humidity (RH), wind speed (U), precipitation (P) and NAO index values and the modelled annual number of days with rime (Nrime), dry snow (Ndry snow), wet snow (Nwet snow) and frozen snow (Nfrozen snow) loads exceeding the value achieved on average on ten days a year. The correlations are shown as an average of the stations in southern (stations 1–9), central (stations 10–19) and northern (stations 20–27) Finland as well as an average of all stations excluding the short time series of the stations 28 and 29. On individual stations, correlations above 0.3 and below –0.3 are statistically significant. | ||||
| Southern | Central | Northern | National | |
| T & Nrime | –0.3 | –0.1 | 0.1 | –0.1 |
| T & Ndry snow | –0.3 | –0.1 | –0.1 | –0.1 |
| T & Nwet snow | 0.1 | 0.4 | 0.3 | 0.3 |
| T & Nfrozen snow | –0.1 | 0.1 | 0.3 | 0.1 |
| RH & Nrime | 0.4 | 0.5 | 0.5 | 0.5 |
| RH & Ndry snow | 0.2 | 0.2 | 0.1 | 0.2 |
| RH & Nwet snow | 0.3 | 0.2 | 0.1 | 0.2 |
| RH & Nfrozen snow | 0.2 | 0.1 | 0.1 | 0.2 |
| U & Nrime | –0.4 | –0.3 | –0.1 | –0.3 |
| U & Ndry snow | –0.6 | –0.5 | –0.5 | –0.5 |
| U & Nwet snow | –0.2 | –0.1 | –0.2 | –0.2 |
| U & Nfrozen snow | –0.3 | –0.3 | –0.2 | –0.3 |
| P & Nrime | –0.2 | 0.0 | 0.1 | –0.1 |
| P & Ndry snow | 0.1 | 0.2 | 0.3 | 0.2 |
| P & Nwet snow | 0.3 | 0.5 | 0.5 | 0.4 |
| P & Nfrozen snow | 0.1 | 0.2 | 0.3 | 0.2 |
| NAO & Nrime | –0.3 | –0.1 | 0.0 | –0.2 |
| NAO & Ndry snow | –0.2 | 0.0 | 0.1 | 0.0 |
| NAO & Nwet snow | 0.2 | 0.3 | 0.2 | 0.2 |
| NAO & Nfrozen snow | 0.0 | 0.1 | 0.1 | 0.1 |
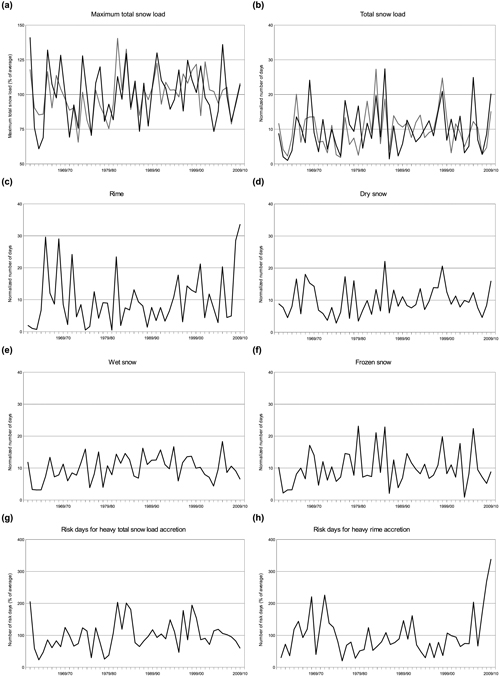
Fig. 11. Temporal variation of modelled heavy snow loads in Finland within the winters between 1961/62–2009/10 as an average of those eight stations where no significant trend in November–March wind speed was apparent during the same period. Variables that are presented are as follows: (a) the maximum annual crown-snow load (% of average) based on the FMI model (black line) and the G08 method (grey line); (b) the annual number of days with the total crown snow load exceeded the value achieved on average on ten days per year at an each station based on the FMI model (black line) and the G08 method (grey line); (c) as in (b) but for the rime load and the FMI model only; (d) as in (c) but for the dry snow load; (e) as in (c) but for the wet snow load; (f) as in (c) but for the frozen snow load; (g) the annual number of risk days for heavy total snow-load accretion (% of average); and (h) as in (g) but for the risk days for heavy rime accretion. View larger in new window/tab.
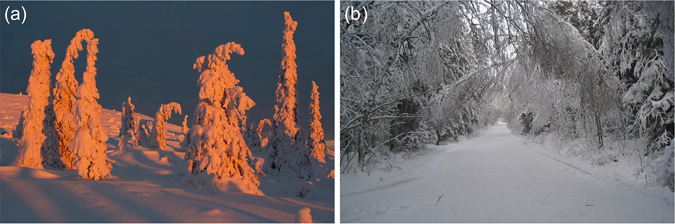
Fig. 12. (a) Spruces heavily loaded by snow and rime in eastern Lapland in January 2014 showing the typical characteristics of the crown snow loads near the alpine timberline. Photo: Teuvo Hietajärvi. (b) Birches bent under heavy crown snow loads in south-western Finland in January 2010. Photo: Ilari Lehtonen.