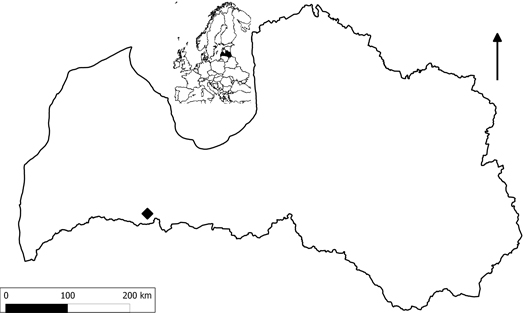
Fig. 1. Location of the study site (black square, 56°27´N, 22°54´E).
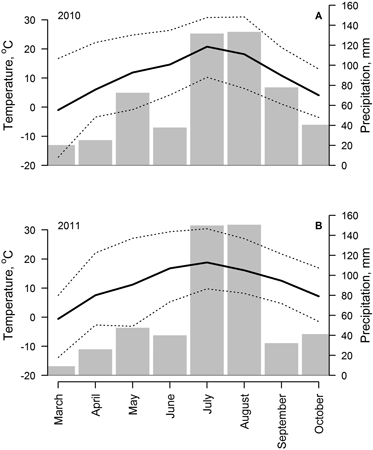
Fig. 2. Weather conditions (monthly mean (solid line), absolute minimum and maximum (dotted lines) temperature and precipitation sums (bars)) from March to November of 2010 (A) and 2011 (B), recorded in meteorological station located at 2 km distance from the study site.
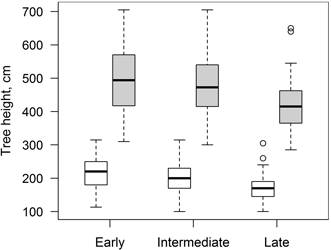
Fig. 3. Mean height of clones of hybrid aspen with early, intermediate and late leaf flushing phenology in the beginning (17.05.2010, white boxes) and at the end (10.10.2011, grey boxes) of the increment monitoring period. Median is shown by the bold line, box corresponds to lower and upper quartile, whiskers show minimum and maximum values (within 150% of interquartile range from the median) and circles represent outliers of the datasets.
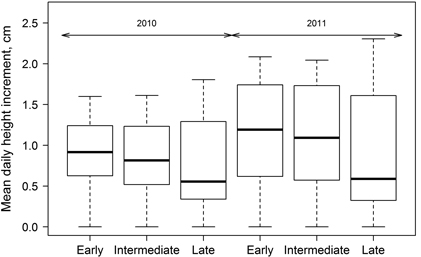
Fig. 4. Mean daily height increment for growing seasons of 2010 and 2011 for clones of hybrid aspen with early, intermediate and late leaf flushing. Median is shown by the bold line, box corresponds to lower and upper quartile, whiskers show minimum and maximum values (within 150% of interquartile range from the median) and circles represent outliers of the datasets.
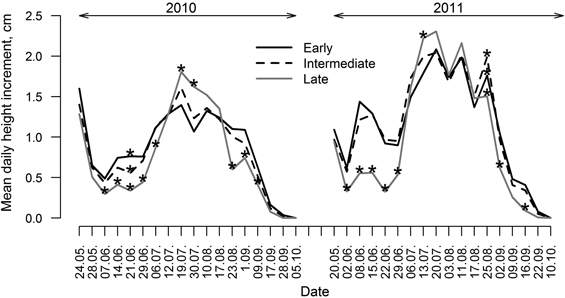
Fig. 5. Mean daily height increment of clones of hybrid aspen with early, intermediate and late leaf flushing phenology, calculated for periods between measurements for growing seasons of 2010 and 2011. Asterisks indicate significance (p-value < 0.05) of differences of height increment among groups of clones with differing phenology of leaf flushing.
| Table 1. Significant variables, their coefficients and significance, and main statistics for developed equations of height increment of hybrid aspen based on weather variables and duration of growth (as HI = ax1 + bx2 +...+ intercept, where x1, x2 etc. are the significant parameters and a, b, etc. are coefficient values) showing the best fit to HI. Equations for data of 2010, 2011 and both years are shown. PET – potential evapotranspiration. | ||||||||
| Early leaf flushing | ||||||||
| 2010 | 2011 | Both years | ||||||
| Variable | Coeff. | p-value | Variable | Coeff. | p-value | Variable | Coeff. | p-value |
| Intercept | 0.142 | 0.719 | Intercept | –1.908 | 0.023 | Intercept | –0.782 | 0.060 |
| Mean temp. | 0.116 | <0.001 | Mean temp. | 0.274 | <0.001 | Mean temp. | 0.192 | <0.001 |
| Temp. sum ( > 5 °C) | –0.003 | 0.033 | Temp. sum ( > 5 °C) | –0.007 | 0.038 | Temp. sum ( > 5 °C) | –0.007 | <0.001 |
| Day of growth | –0.006 | 0.032 | ||||||
| AIC | –29.2 | –19.97 | –38.69 | |||||
| F-statistic | 16.51 | 15.94 | 24.15 | |||||
| R-squared | 0.81 | 0.69 | 0.62 | |||||
| Adjuster R-squared | 0.76 | 0.65 | 0.59 | |||||
| Residual standard error | 0.34 | 0.53 | 0.53 | |||||
| Intermediate leaf flushing | ||||||||
| 2010 | 2011 | Both years | ||||||
| Variable | Coeff. | p-value | Variable | Coeff. | p-value | Variable | Coeff. | p-value |
| Intercept | –0.684 | 0.061 | Intercept | –1.201 | 0.186 | Intercept | –1 | 0.026 |
| Mean temp. | 0.159 | <0.001 | Mean temp. | 0.396 | <0.001 | Mean temp. | 0.208 | <0.001 |
| Temp. sum ( > 5 °C) | –0.005 | 0.002 | Solar radiation | 1.165 | 0.004 | Temp. sum ( > 5 °C) | –0.007 | <0.001 |
| PET | –3.409 | 0.003 | ||||||
| AIC | –27.62 | –20.66 | –34.62 | |||||
| F-statistic | 21.89 | 15.47 | 24.74 | |||||
| R-squared | 0.78 | 0.77 | 0.62 | |||||
| Adjuster R-squared | 0.75 | 0.72 | 0.6 | |||||
| Residual standard error | 0.36 | 0.51 | 0.57 | |||||
| Late leaf flushing | ||||||||
| 2010 | 2011 | Both years | ||||||
| Variable | Coeff. | p-value | Variable | Coeff. | p-value | Variable | Coeff. | p-value |
| Intercept | –1.082 | 0.009 | Intercept | –1.169 | 0.265 | Intercept | –0.312 | 0.617 |
| Mean temp. | 0.174 | <0.001 | Mean temp. | 0.489 | <0.001 | Mean temp. | 0.337 | <0.001 |
| Temp. sum ( > 5 °C) | –0.005 | 0.006 | PET | –4.475 | 0.002 | PET | –3.354 | 0.003 |
| Solar radiation | 1.389 | 0.006 | Solar radiation | 1.038 | 0.005 | |||
| AIC | –26.02 | –12.76 | –22.75 | |||||
| F-statistic | 23.6 | 12.18 | 12.81 | |||||
| R-squared | 0.8 | 0.72 | 0.57 | |||||
| Adjuster R-squared | 0.76 | 0.66 | 0.53 | |||||
| Residual standard error | 0.38 | 0.64 | 0.67 | |||||