| Table 1. Clones included in the study (origin from a clone test (Stener 2004)). | |||||
| Clone ID a) | Taxon | Dbh d) (cm) | No. of stumps | Additional information | |
| Co1 | (5) | P. maximowiczii b) × P. trichocarpa b) | 40.1 | 7 | USA, Commercial name ‘Androscoggin’ |
| Co2 | (4) | P. maximowiczii × P. nigra b) | 36.5 | 10 | USA, Commercial name ‘Rochester’ |
| Co3 | (113) | P. maximowiczii × P. trichocarpa | 46.3 | 4 | USA |
| Co4 | (8) | Balsam type c) | 36.5 | 4 | Unknown origin |
| Co5 | (122) | P. trichocarpa | 35 | 4 | Br. Columbia, Canada |
| Co6 | (108) | P. trichocarpa | 32 | 4 | Br. Columbia, Canada |
| Co7 | (97) | P. trichocarpa | 29.7 | 3 | Alaska, USA |
| Co8 | (38) | Balsam type c) | 38.8 | 4 | Unknown origin |
| Ca1 | (87) | P. trichocarpa | 36.7 | 3 | Washington, USA |
| Ca2 | (37) | P. deltoides b) × P. nigra | 35.3 | 3 | Unknown origin |
| Ca3 | (67) | P. trichocarpa | 30.4 | 5 | Br. Columbia, Canada |
| Ca4 | (103) | P. trichocarpa | 31 | 4 | Br. Columbia, Canada |
| Ca5 | (50) | P. trichocarpa | 29.4 | 5 | Br. Columbia, Canada |
| Ca6 | (111) | P. trichocarpa | 34.8 | 4 | Br. Columbia, Canada |
| Ca7 | (92) | P. trichocarpa | 29 | 4 | Br. Columbia, Canada |
| 1 | (51) | P. trichocarpa | 26.8 | 4 | Oregon, USA |
| 2 | (2) | P. deltoides × P. trichocarpa | 38.3 | 4 | Wageningen, Netherlands, Commercial name ‘Barn’ |
| 3 | (45) | P. trichocarpa | 26.3 | 4 | Washington, USA |
| 4 | (104) | P. trichocarpa | 25.8 | 4 | Washington, USA |
| 5 | (54) | P. trichocarpa | 25.6 | 5 | Oregon, USA |
| 6 | (66) | P. trichocarpa | 23.8 | 5 | Br. Columbia, Canada |
| 7 | (96) | P. trichocarpa | 29.3 | 4 | Oregon, USA |
| 8 | (121) | P. trichocarpa | 19.3 | 4 | Br. Columbia, Canada |
| a) Commercial clones start with clone ID ‘Co’, candidates start with ‘Ca’ and additional clones are numbered in the bottom. In parentheses Skogforsk’s ID is given. b) P. maximowiczii Henry, P. trichocarpa Torr. & Gary, P. deltoides Marsh., P. nigra L. c) Unknown clones of P. trichocarpa, P. balsamifera L. or hybrids of these two species. d) Dbh refers to the felled trees. | |||||
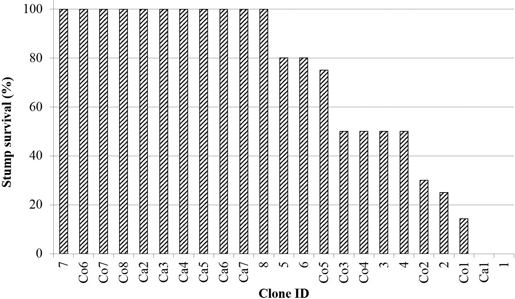
Fig. 1. The relative frequency of stump survival (meaning stumps supporting live sprouts). For clone information, see Table 1.
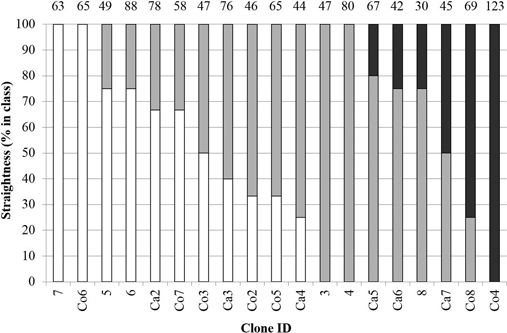
Fig. 2. Sprout straightness (white = straight (class 1), grey = crooked (class 2), black = severely crooked (class 3)). Numbers on top represent the mean number of sprouts per stump. For clone information, see Table 1.
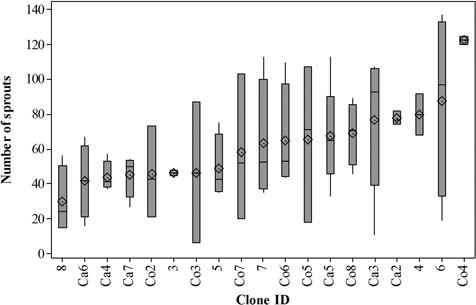
Fig. 3. Quartile range box of number of sprouts per stump. Vertical lines are the upper and lower whiskers, representing the boarders of the data. Top line in the box is the third quartile, middle line is the median, and bottom line is the first quartile. Mean value is shown by a diamond. For clone information, see Table 1.