| Table 1. Biometric data for Eucalyptus globulus trees grown with different planting densities in the 1st cutting cycle, as single stem trees, and in the 2nd cutting cycle, as coppiced trees. The values refer to the same five stumps per spacing in the two cutting cycles. Mean values and standard deviation. | |||||
| 4×5 | 4×4 | 4×3 | 3×3 | 3×2 | |
| 2nd rotation | |||||
| D.b.h. (cm) | 18.5 ± 3.1a | 14.5 ± 2.9a | 18.4 ± 5.0a | 16.8 ± 5.4a | 19.6 ± 3.4a |
| Height (m) | 22.3 ± 2.1a | 20.2 ± 3.0a | 22.3 ± 3.3a | 20.9 ± 5.0a | 24.7 ± 2.9a |
| Tree volume (m3) | 0.30 ± 0.07 | 0.20 ± 0.08 | 0.30 ± 0.15 | 0.25 ± 0.17 | 0.35 ± 0.13 |
| Number of stems per stump | 2.0 ± 1.0 | 2.0 ± 1.0 | 1.6 ± 0.5 | 1.4 ± 0.5 | 1.4 ± 0.5 |
| Volume per stump (m3) | 0.64 ± 0.30 | 0.48 ± 0.39 | 0.55 ± 0.34 | 0.38 ± 0.30 | 0.40 ± 0.16 |
| 1st rotation | |||||
| D.b.h. (cm) | 26.2 ± 5.9 | 22.9 ± 5.5 | 21.8 ± 3.8 | 20.0 ± 5.3 | 17.7 ± 5.4 |
| Height (m) | 26.9 ± 4.1 | 25.7 ± 3.8 | 26.2 ± 2.5 | 24.4 ± 4.5 | 21.2 + 7.4 |
| Tree volume (m3) | 0.67 ± 0.32 | 0.51 ± 0.26 | 0.45 ± 0.19 | 0.38 ± 0.20 | 0.32 ± 0.11 |
| The same letters within rows indicate non-significant differences. | |||||
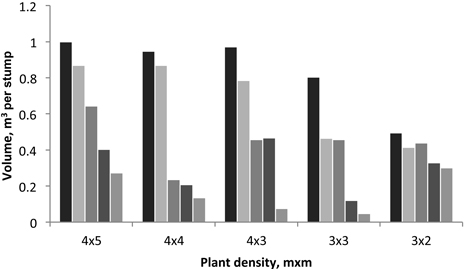
Fig. 1. Variation of tree volume produced by each stump in the 2nd rotation for each spacing. Individual bars represent the five stumps sampled in each spacing plot.
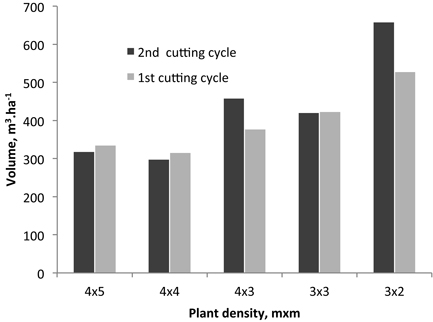
Fig. 2. Volume production per ha for the 2nd and 1st rotations from different initial planting densities.
| Table 2. Variation of heartwood diameter, proportion and volume, and sapwood radial width at breast height in the 18-year-old coppiced E. globulus trees grown in the different spacing plots, as well as data published for the 1st rotation (Miranda et al. 2009). Mean of all coppiced trees per spacing and standard deviation. | |||||
| 4×5 | 4×4 | 4×3 | 3×3 | 3×2 | |
| 2nd rotation | |||||
| Heartwood diameter (cm) | 11.5 ± 4.2a | 8.5 ± 3.8a | 10.7 ± 3.0a | 8.4 ± 3.6a | 14.3 ± 1.0a |
| Heartwood proportion (% total area) | 58.8 ± 7.2a | 46.28 ± 12.4a | 51.1 ± 10.4a | 46.4 ± 16.7a | 61.7 ± 6.3a |
| Sapwood width (cm) | 1.7 ± 0.1a | 2.1 ± 0.8a | 1.9 ± 0.6a | 2.0 ± 0.4a | 1.8 ± 0.4a |
| Heartwood height (% total height) | 48.1 ± 6.8 | 42.5 ± 8.6 | 49.3 ± 7.2 | 52.5 ± 8.2 | 57.3 ± 2.4 |
| Heartwood volume (m3) | 0.075 ± 0.04a | 0.051 ± 0.02a | 0.061 ± 0.03a | 0.083 ± 0.06a | 0.097 ± 0.02a |
| Heartwood volume proportion (% total) | 41.2 ± 12.1 | 38.9 ± 11.1 | 42.8 ± 9.7 | 43.5 ± 13.6 | 51.7 ± 5.9 |
| 1st rotation | |||||
| Heartwood diameter (cm) | 15.7 ± 4.2 | 13.3 ± 4.2 | 13.2 ± 3.4 | 11.63 ± 4.21 | 10.31 ± 4.99 |
| Heartwood proportion (% total area) | 62.0 ± 9.9 | 59.4 ± 9.9 | 61.8 ± 8.0 | 57.7 ± 13.9 | 58.4 ± 17.5 |
| Sapwood width (cm) | 2.1 ± 0.7 | 1.9 ± 0.4 | 1.8 ± 0.5 | 1.8 ± 0.4 | 1.5 ± 0.5 |
| The same letters within rows indicate non-significant differences. | |||||
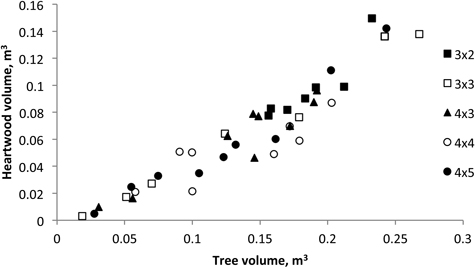
Fig. 3. Heartwood volume versus tree volume of 18-year-old Eucalyptus globulus in the 2nd rotation for the five spacings.
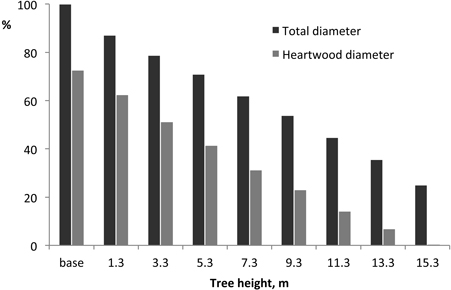
Fig. 4. Variation of tree and heartwood diameter along the tree height. Mean value for all trees, normalised at a reference value of 100 at the base.
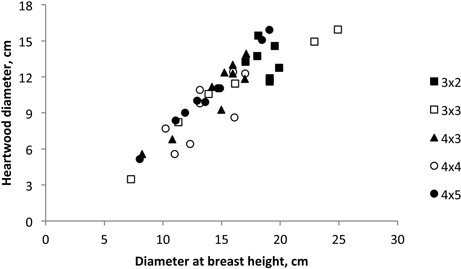
Fig. 5. Heartwood diameter versus tree breast height diameter of 18-year-old Eucalyptus globulus in the 2nd rotation for each stump for the five spacings.
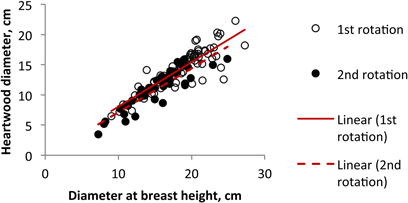
Fig. 6. Relationship between heartwood diameter and tree diameter at b.h. of Eucalyptus globulus at 18 years of age at the end of the 1st and 2nd rotations.
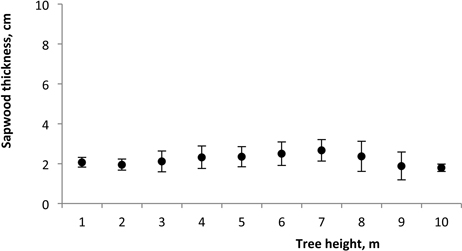
Fig. 7. Variation of sapwood thickness along the tree height of 18-year-old Eucalyptus in the 2nd rotation. Mean value for all trees.
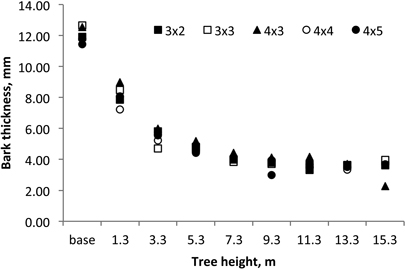
Fig. 8. Axial variation of bark thickness in 18-year-old Eucalyptus globulus in the 2nd rotation for the five spacings.
| Table 3. Variation of bark thickness at b.h. and bark content in % of volume of 18-year-old coppiced (2nd rotation) and single stem (1st rotation) Eucalyptus globulus trees grown in the different spacing plots. Mean of all coppiced trees per spacing and standard deviation. | |||||
| 4×5 | 4×4 | 4×3 | 3×3 | 3×2 | |
| 2nd rotation | |||||
| Bark thickness (mm) | 8.5 ± 2.6a | 7.7 ± 1.5a | 8.6 ± 2.0a | 7.9 ± 2.6a | 8.6 ± 1.6a |
| Bark content (% bolewood) | 17.4 ± 0.1 | 17.4 ± 0.1 | 17.4 ± 0.1 | 17.4 ± 0.2 | 17.4 ± 0.1 |
| 1st rotation | |||||
| Bark thickness (mm) | 10.3 ± 2.5 | 9.2 ± 2.8 | 8.9 ± 2.5 | 7.8 ± 2.6 | 6.6 ± 2.8 |
| Bark content (% bolewood) | 14.4 ± 0.5 | 13.4 ± 2.5 | 14.0 ± 0.7 | 13.8 ± 0.7 | 13.4 ± 1.1 |
| The same letters within rows indicate non-significant differences. | |||||