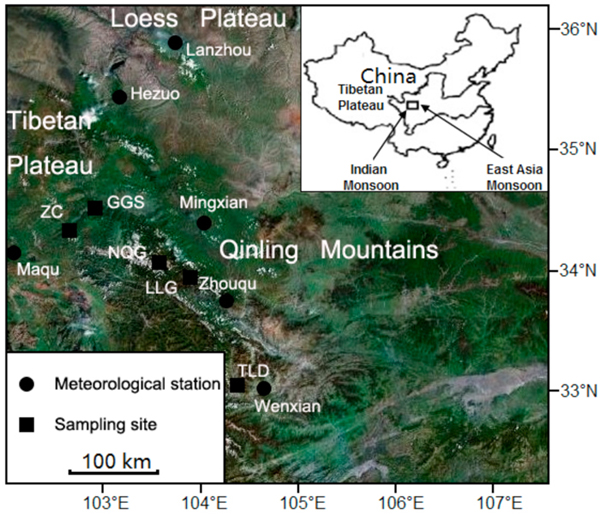
Fig. 1. Locations of tree-ring sites and meteorological stations in the western Qinling Mountains and northeastern Tibetan Plateau, China.
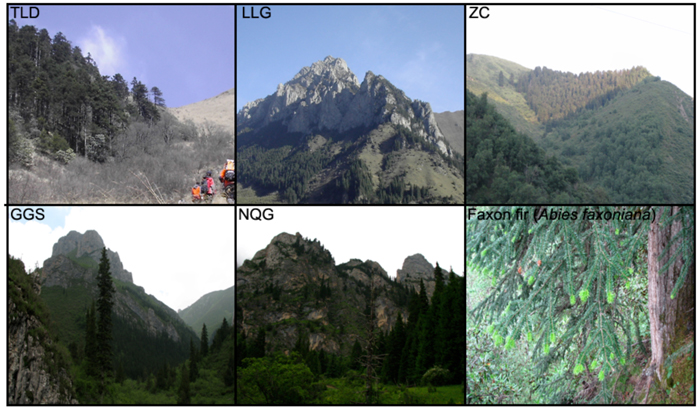
Fig. 2. Faxon fir forest at the timberline sites in the western Qinling Mountains and northeastern Tibetan Plateau, China, and a typical Faxon fir tree sampled in this study.
| Table 1. Information about the sampling sites in the western Qinling Mountains and northeastern Tibetan Plateau. | ||||||
| Site | Latitude (N) | Longitude (E) | Trees / 5-mm diameter cores / 10-mm diameter cores number | Elevation (m) | Aspect | Slope |
| LLG | 34°07´ | 103°48´ | 21/38/0 | 3120–3200 | NW | 10–50° |
| NQG | 34°09´ | 103°31´ | 21/21/42 | 3100–3190 | N | 20–40° |
| TLD | 32°56´ | 104°17´ | 24/48/0 | 3200–3280 | E | 20–30° |
| ZC | 34°26´ | 102°43´ | 23/23/44 | 3300–3320 | N | 20–40° |
| GGS | 34°20´ | 102°59´ | 22/22/44 | 3310–3350 | NE | 30–40° |
| Table 2. Descriptive statistics for the standard tree-ring chronologies in the western Qinling Mountains and northeastern Tibetan Plateau. TRW: tree-ring width; MXD: maximum latewood density; MS: the mean sensitivity; AC1: the AutoCorrelation order 1; SD: the standard deviation; SNR: the signal-to noise ratio; PC1: the first principal components; EPS: the expressed population signal. | ||||||||||
| Site | Type of parameter | Time span | MS | SD | SNR | AC1 | R | EPS | PC1 | EPS > 0.85, ≥5 series |
| LLG | TRW | 1598–2006 | 0.12 | 0.24 | 17.27 | 0.74 | 0.50 | 0.95 | 30.0 | 1650 |
| TLD | TRW | 1737–2006 | 0.13 | 0.19 | 21.41 | 0.66 | 0.55 | 0.96 | 31.3 | 1770 |
| ZC | TRW | 1650–2006 | 0.11 | 0.16 | 11.13 | 0.58 | 0.52 | 0.92 | 32.1 | 1685 |
| GGS | TRW | 1603–2008 | 0.12 | 0.21 | 6.63 | 0.66 | 0.47 | 0.87 | 33.6 | 1635 |
| ZC | MXD | 1667–2008 | 0.05 | 0.05 | 6.77 | 0.28 | 0.42 | 0.87 | 26.6 | 1720 |
| GGS | MXD | 1625–2008 | 0.04 | 0.05 | 3.32 | 0.40 | 0.51 | 0.85 | 38.6 | 1685 |
| NQG | MXD | 1603–2008 | 0.07 | 0.07 | 7.26 | 0.18 | 0.54 | 0.88 | 38.5 | 1650 |
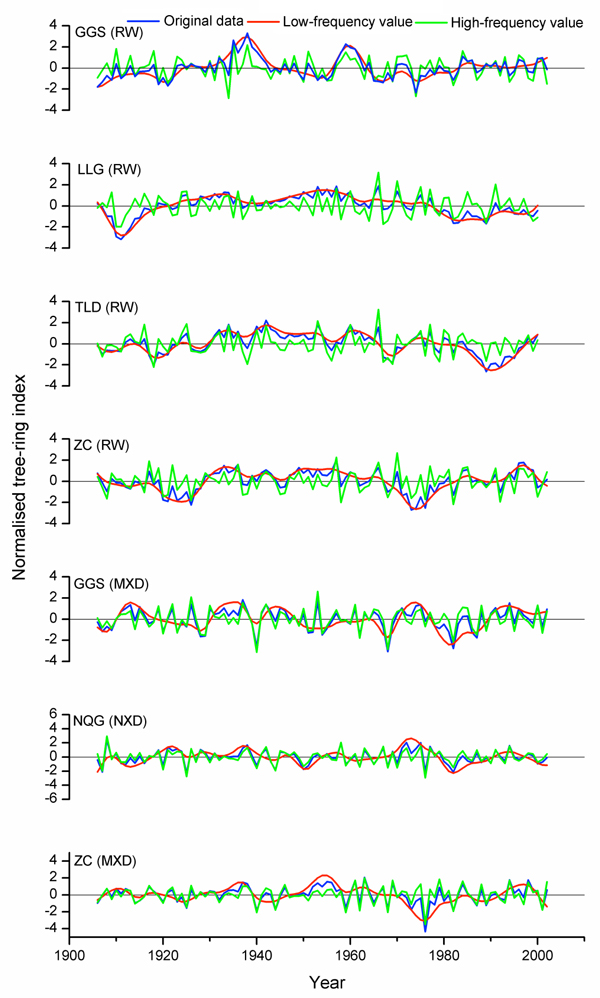
Fig. 3. Tree-ring chronologies of Faxon fir (1900–2008) from the five study sites. TRW: tree-ring width; MXD: maximum latewood density.
| Table 3. Cross-correlations for tree-ring indices before and after filtering during the common period (1900–2008). TRW: tree-ring width; MXD: maximum latewood density. | ||||||
| Site | GGS (TRW) | LLG (TRW) | TLD (TRW) | ZC (TRW) | GGS(MXD) | NQ (MXD) |
| Unfiltered signals | ||||||
| LLG (TRW) | 0.39** | |||||
| TLD (TRW) | 0.51** | 0.51** | ||||
| ZC (TRW) | 0.46** | 0.26** | 0.22 | |||
| GGS (MXD) | 0.29** | 0.08 | 0.17 | 0.14 | ||
| NQ (MXD) | –0.23* | 0.00 | 0.12 | 0.16 | 0.32** | |
| ZC (MXD) | 0.07 | 0.03 | 0.11 | 0.40** | 0.38** | 0.48** |
| Low frequency | ||||||
| LLG (TRW) | 0.20* | 1.00 | ||||
| TLD (RW) | 0.36** | 0.55** | ||||
| ZC (TRW) | 0.40** | 0.21* | 0.27** | |||
| GGS (MXD) | 0.23* | 0.00 | 0.16 | 0.01 | ||
| NQ (MXD) | 0.10 | 0.34** | 0.02 | –0.41** | 0.41** | |
| ZC (MXD) | 0.26* | 0.20 | 0.11 | 0.73** | 0.02 | 0.12 |
| High frequency | ||||||
| LLG (TRW) | 0.16 | 1.00 | ||||
| TLD (TRW) | 0.06 | 0.57** | 1.00 | |||
| ZC (TRW) | 0.02 | 0.52** | 0.37** | 1.00 | ||
| GGS (MXD) | 0.02 | 0.20* | 0.24* | 0.29** | 1.00 | |
| NQ (MXD) | 0.03 | 0.05 | 0.10 | 0.02 | 0.35** | 1.00 |
| ZC (MXD) | 0.04 | 0.01 | 0.06 | 0.19 | 0.57** | 0.66** |
| * p < 0.05; ** p < 0.01 | ||||||
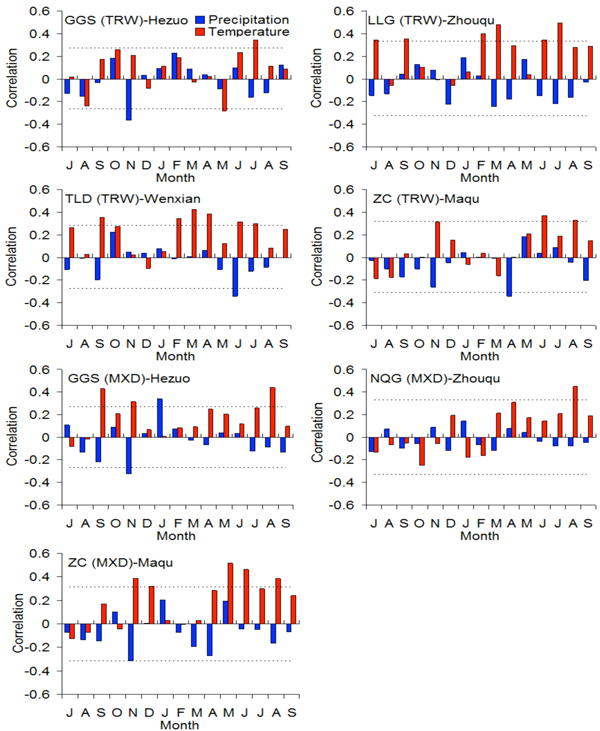
Fig. 4. Correlations of tree-ring chronologies of Faxon fir with climatic characteristics in the western Qinling Mountains and northeastern Tibetan Plateau, obtained from simple correlations (bars). The dot lines indicate significant variables (P < 0.05). TRW: tree-ring width; MXD: maximum latewood density.
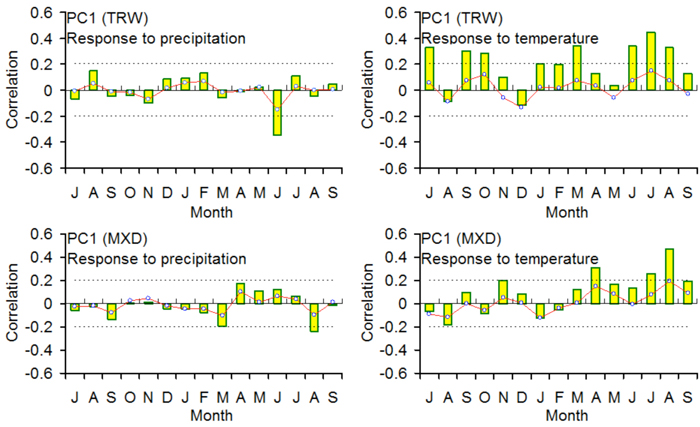
Fig. 5. The bootstrapped response (lines) and correlation (bars) functions of the first principal components of the TRW chronologies (PC1TRW) and the MXD chronologies (PC1MXD) with the monthly sum of precipitation and the monthly mean temperature from previous July to current September (1937–2008). The dotted lines indicate significance levels (p < 0.05). TRW: tree-ring width; MXD: maximum latewood density.
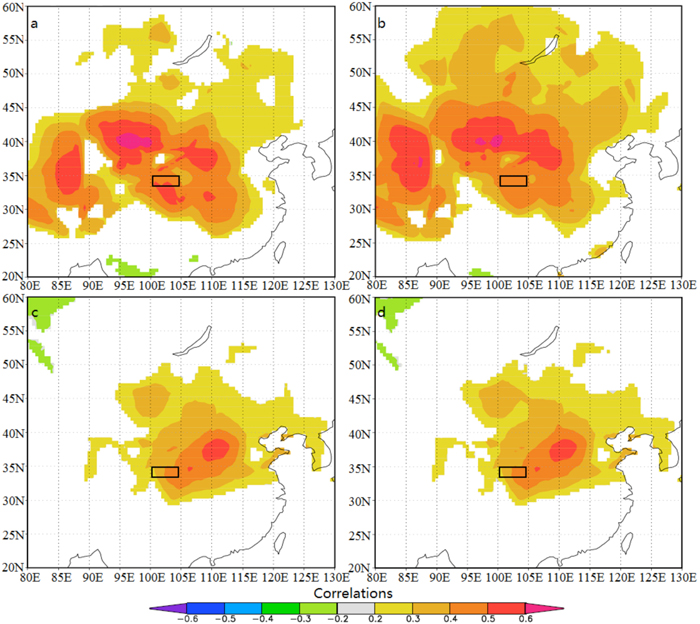
Fig. 6. (a) Spatial correlations between the gridded June–August temperature (CRU TS3.1) and the first principal component of the TRW chronologies (PC1TRW) for the period 1937–2008. (b) Spatial correlations between the gridded June–August temperature (CRU TS3.1) and the detrended PC1TRW. (c) Spatial correlations between the gridded August temperature (CRU TS3.1) and the first principal component of the MXD chronologies (PC1MXD). (d) Spatial correlations between the gridded August temperature (CRU TS3.1) and the detrended PC1MXD for the period 1937–2008.
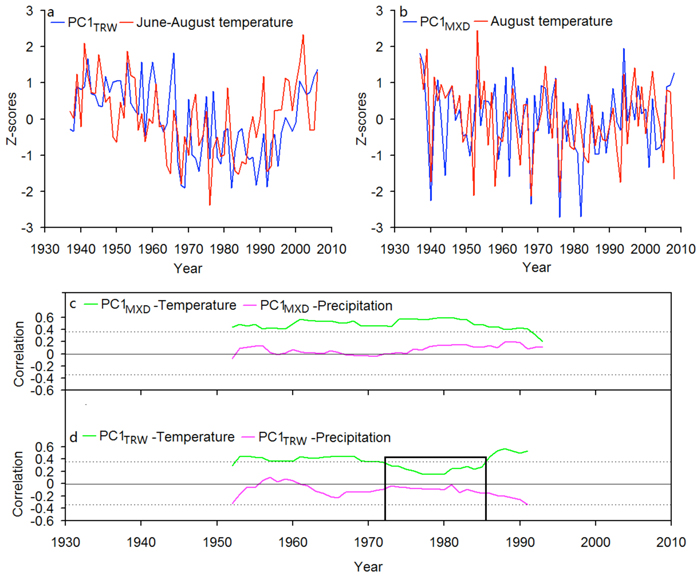
Fig. 7. (a) Comparison between the first principal component of the TRW chronologies (PC1TRW) and June–August temperature. (b) Comparison between the first principal component of the MXD chronologies (PC1MXD) and August temperature. (c) Running 31-year correlation between PC1MXD and August temperature. (d) Running 31-year correlation between PC1TRW and June–August temperature. TRW: tree-ring width; MXD: maximum latewood density.