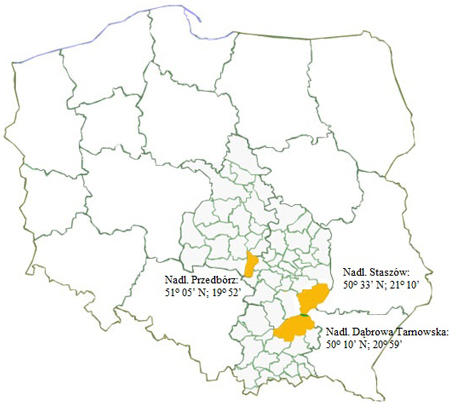
Fig. 1. Location of the research areas. The research was conducted in mature stands (Staszów Forest District) and in post-disaster areas (Dąbrowa Tarnowska Forest District and Przedbórz Forest District).
| Table 1. Characteristics of the research areas. View in new window/tab. |
| Table 2. Flow chart presenting the classification of harvester operation times during work in standard areas and in post-disaster stands. Numerical codes referring to the classification applied were used to construct time series. | |||||
| D W t – Direct Work time | Main Work time | M W t | Numerical code of time category | 1,1 | Crane out, positioning, cutting, felling |
| 1,2 | Pulling tree into machine, debranching, cross-cutting | ||||
| Auxiliary Work time | C W t | 2,1 | Travelling time on worksite | ||
| 2,2 | Worksite prepartion time – removing disturbing branches and log fragments hindering access to tree stem being cut | ||||
| 2,4 | Time of log arrangement and timber sorting | ||||
| Unavoidable Delay time | U D t | 2,3 | Technological downtime – breaks due to work organisation, route setting and tree cutting order | ||
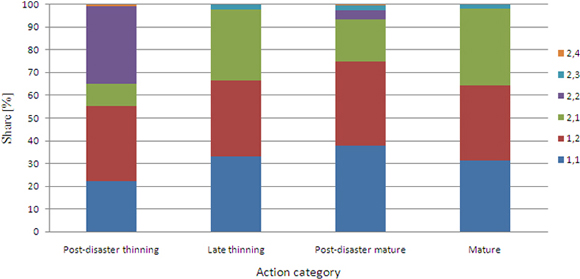
Fig. 2. Structure of harvester work time in areas of standard utilization and with windbreaks. The activities noted were grouped in respective time categories in accordance with Table 2.
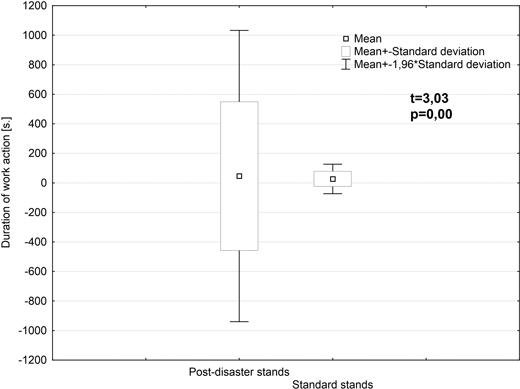
Fig. 3. Significance of differences in the duration of harvester work activities in standard stands and those with windbreaks. Larger differentiation of activity duration in post-disaster stands is visible.
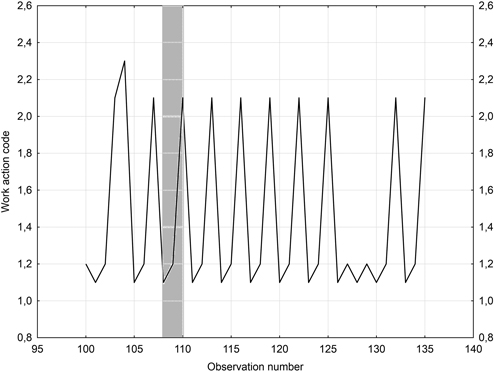
Fig. 4. Fragment of a time series of harvester operations – TP (late thinning). The points at which the line is broken indicate the occurrence of a given time category. The cycles described in this paper are marked with grey color.
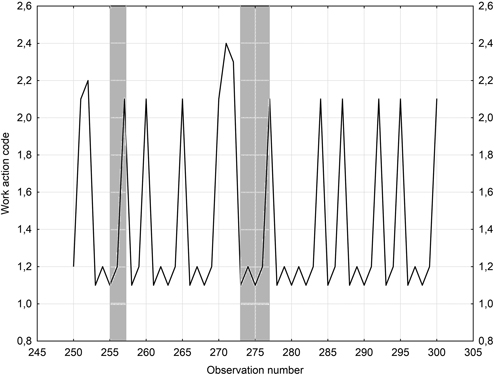
Fig. 5. Fragment of a time series of harvester operations – WL-R (post-disaster mature). The points at which the line is broken indicate the occurrence of a given time category. The cycles described in this paper are marked with grey color.
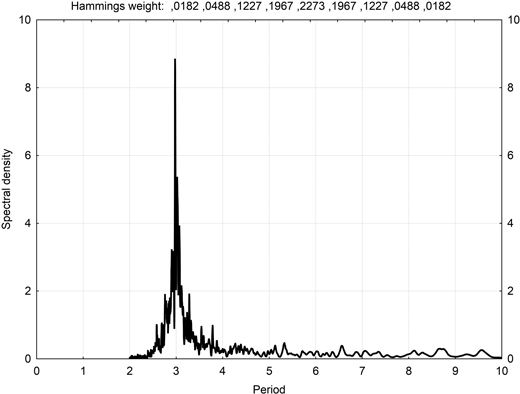
Fig. 6. Fragment of a periodogram of harvester work in late thinning stands (TP). The highest peak of the periodogram shows the strongest operational cycles.
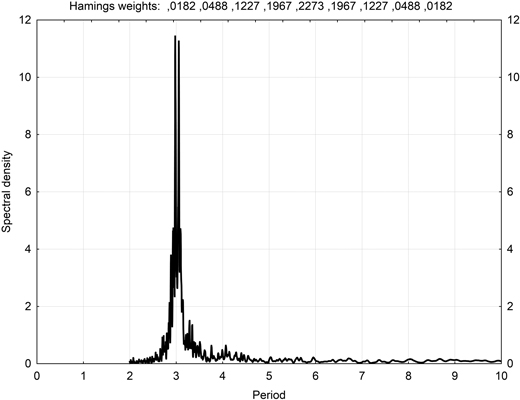
Fig. 7. Fragment of a periodogram of harvester work in mature stands (R). The highest peak of the periodogram shows the strongest operational cycles.
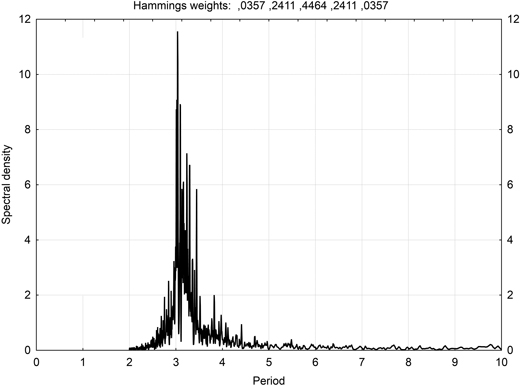
Fig. 8. Fragment of a periodogram of harvester work in stands of the late thinning age class with windbreaks (WL-TP). The highest peak of the periodogram shows the strongest operational cycles. Variation of operation which is slightly larger in comparison with post-disaster stands is visible.
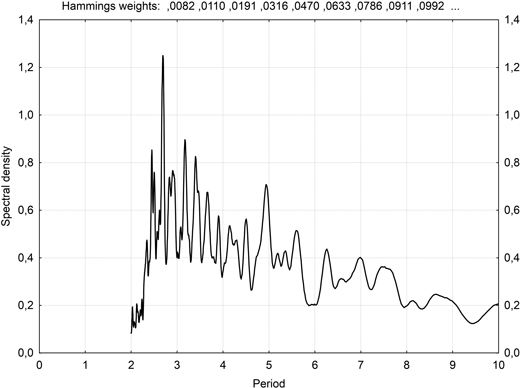
Fig. 9. Fragment of a periodogram of harvester work in stands of the mature age class with windbreaks (WL-R). The highest peak of the periodogram shows the strongest, shortest operational cycles which overlap with longer cycles (the peak for the length of a five-activity cycle).
| Table 3. Average duration of a harvester operational cycle in standard stands and in post-disaster areas. | |||||
| Variant, stand | Sample size – number of observations | Number of analysed cycles | Mean duration of work cycle [s] | Difference in relation to standard stands [%] | |
| Name | Symbol | ||||
| Late thinning | TP | 3214 | 957 | 88 | |
| Mature | R | 3132 | 925 | 60 | |
| Post-disaster mature | WL-R | 6761 | 1252 | 113 | +28 |
| Post-disaster thinning | WL-TP | 5639 | 988 | 93 | +55 |