| Table 1. Mean diameters of living seedlings of the included tree species at the start of the field experiment and the end of the first season, analysed with a general linear model (Proc GLM, SAS) and separated by overall pair-wise comparisons using Tukey’s test, indicated with different letters, SE in brackets. | ||
| Tree species | Initial diameter (mm) | Diameter at the end of the first season (mm) |
| Norway spruce | 4.2 (0.10)b | 5.1 (0.17)de |
| Sitka spruce | 4.2 (0.12)b | 6.1 (0.20)c |
| Douglas fir | 4.5 (0.12) b | 5.7 (0.21)dc |
| Lodgepole pine | 3.9 (0.14)b | 5.9 (0.16)c |
| Scots pine | 7.3 (0.15)a | 8.5 (0.19)b |
| Hybrid larch | 7.5 (0.22)a | 9.5 (0.34)a |
| Hybrid aspen | 4.0 (0.14)b | 4.8 (0.16)e |
| Table 2. Results of analysis on differences in root collar diameter between tree species on seedling mortality and severe damage caused by pine weevil using a mixed model (Proc Mixed SAS), with initial seedling diameter as a covariate. | ||||||
| Seedling killed | Killed or severely damaged | |||||
| Df | F-value | P-value | Df | F-value | P-value | |
| Tree species | 6 | 2.78 | 0.02 | 6 | 3.08 | 0.01 |
| Diameter | 1 | 0.15 | 0.70 | 1 | 0.06 | 0.82 |
| Diameter × tree species | 6 | 1.17 | 0.33 | 6 | 1.25 | 0.29 |
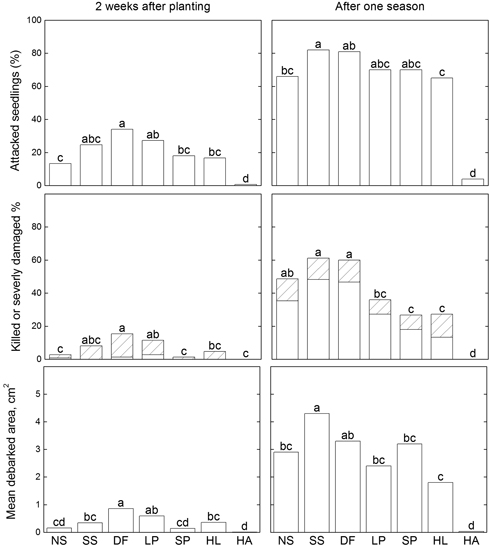
Fig. 1. Results of pine weevil damage to seedlings of different tree species; proportions of attacked seedlings (top diagram), killed, (unfilled bars) or severely damaged (lined bars) (middle diagram), and mean debarked area (bottom diagram) assessed after two weeks and after one season, using a general linear model (Proc GLM, SAS) followed by Tukey’s tests to separate effects of individual factors when significant differences were identified. Significant differences (p < 0.05) are indicated with different letters above the bars. Abbreviations of species names: NS = Norway spruce, SS = Sitka spruce, DF = Douglas fir, LP = lodgepole pine, SP = Scots pine, HL = Hybrid larch, HA = Hybrid aspen.

Fig. 2. Results of the distribution of the main feeding on the stem of seedlings of indicated tree species using a vertical scale from 1 at the base to 10 at the top of the seedling, shown as mean proportion of seedlings (± SE) on different positions.
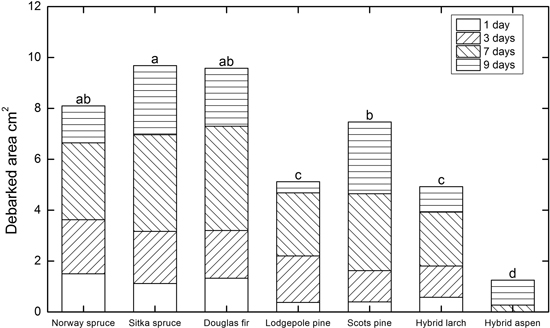
Fig. 3. Mean debarked area on seedlings of the indicated species after 1, 3, 7, and 9 days in the laboratory experiment. Significant differences after 9 days were tested with a general linear model (Proc GLM, SAS) and were separated by overall pair-wise comparisons using Tukey’s test, indicated in the diagram with different letters above the bars when (p < 0.05).