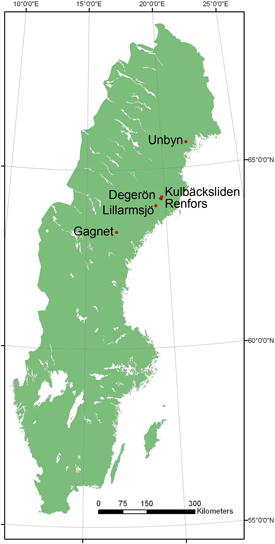
Fig. 1. Map of all sites where biomass sampling was undertaken.
| Table 1. Characteristics of the studied stands. | ||||||
| Variable | Renfors | Degerön | Kulbäcksliden | Gagnet | Lillarmsjö | Unbyn |
| Altitude (m a.s.l.) | 190 | 175 | 170 | 125 | 220 | 20 |
| H100 (m) a) | 18 | 20 | 20 | 24 | 21 | 19 |
| Latitude (ºN) b) | 64.21 | 6415 | 64.17 | 63.26 | 63.97 | 65.69 |
| Longitude (ºE) b) | 19.70 | 19.67 | 19.62 | 16.79 | 19.30 | 21.58 |
| Soil c) | Loamy sand | Sandy loam | Loamy sand | Sandy loam | Sandy loam | Silt loam |
| Mean annual precipitation (mm) d) | 700–800 | 700–800 | 700–800 | 700–800 | 700–800 | 600–700 |
| Growing season length (days) e) | 120–150 | 120–150 | 120–150 | 150–180 | 150–180 | 150–180 |
| a) H100 site index (dominant height at 100 yrs of age) for Pinus sylvestris L. according to definitions by Hägglund and Lundmark (1977). b) Latitude and Longitude are given in degrees and decimals of degrees (WGS84). c) Soil textural classes are specified according to the definitions of Hägglund and Lundmark (1987). d) Annual precipitation mean values from the meteorological period 1961–1990 (2014). e) Defined as the number of days for which the daily mean temperature was > 5 °C mean values from the meteorological period 1961–1990. (Growing season length 2014). | ||||||
| Table 2. Arithmetic mean diameter at breast height (dbh), dominant height (defined as the mean height of the 100 largest trees per hectare), basal area, and number of stems for the different sites considered in this work, for trees > 1.3 m in height. | |||||||
| Variable | Year | Renfors | Degerön | Kulbäcksliden | Gagnet | Lillarmsjö | Unbyn |
| dbh (mm) | 1997–1998 | 24 | 16 | 26 | 38 | 38 | 33 |
| 2002 | 29 | 20 | 27 | ||||
| 2010 | 42 | 61 | |||||
| Dominant height (m) | 1997–1998 | 5.2 | 4.2 | 5.1 | 6.0 | 7.1 | 7.2 |
| 2002 | 9.7 | 6.0 | 9.3 | ||||
| 2010 | 10.0 | 12.7 | |||||
| Basal area m2 ha–1 | 1997–1998 | 10.0 | 7.0 | 11.4 | 21.1 | 21.2 | 23.9 |
| 2002 | 20.3 | 18.0 | 20.3 | ||||
| 2010 | 32.0 | 26.7 | |||||
| No. of stems ha–1 | 1997–1998 | 13 500 | 24 900 | 13 800 | 18 330 | 12 140 | 20 375 |
| 2002 | 17 400 | 34 000 | 18 300 | ||||
| 2010 | 14 460 | 4060 | |||||
| Table 3. Number of sample trees per dbh a) class and height class for each species. | ||||||||||||
| Height (m) | dbh (cm) | N Total | ||||||||||
| 0–2 | 2–4 | 4–6 | 6–8 | 8–10 | 10–12 | 12–14 | 14–16 | 16–18 | 18–20 | 20–22 | ||
| Scots pine | ||||||||||||
| 1.3–3 | 11 | 18 | 29 | |||||||||
| 3–5 | 15 | 20 | 2 | 37 | ||||||||
| 5–7 | 3 | 9 | 13 | 7 | 32 | |||||||
| 7–9 | 2 | 11 | 3 | 2 | 18 | |||||||
| 9–11 | 2 | 2 | 2 | 8 | ||||||||
| 11–13 | 1 | 1 | 1 | 1 | 2 | |||||||
| Total | 11 | 36 | 29 | 17 | 18 | 5 | 4 | 3 | 1 | 1 | 1 | 126 |
| Norway spruce | ||||||||||||
| 1.3–3 | 7 | 8 | 15 | |||||||||
| 3–5 | 8 | 12 | 1 | 21 | ||||||||
| 5–7 | 7 | 11 | 2 | 20 | ||||||||
| 7–9 | 5 | 1 | 6 | |||||||||
| 9–11 | 2 | 1 | 3 | |||||||||
| 11–13 | 1 | 1 | 2 | |||||||||
| 13–15 | 1 | 1 | ||||||||||
| Total | 7 | 16 | 19 | 12 | 7 | 3 | 1 | 1 | 1 | 0 | 1 | 68 |
| Birch | ||||||||||||
| 1.3–3 | 11 | 2 | 13 | |||||||||
| 3–5 | 2 | 24 | 2 | 28 | ||||||||
| 5–7 | 1 | 4 | 12 | 6 | 23 | |||||||
| 7–9 | 4 | 9 | 7 | 20 | ||||||||
| 9–11 | 1 | 1 | 2 | |||||||||
| 11–13 | ||||||||||||
| 13–15 | ||||||||||||
| Total | 14 | 30 | 18 | 15 | 8 | 1 | 86 | |||||
| a) dbh, diameter at breast height | ||||||||||||
| Table 4. Number of sampled trees for each site per year and species. | ||||
| Site | Year | Scots pine | Norway spruce | Birch |
| Degerön | 1997 | 20 | 6 | 15 |
| Renfors | 1997 | 18 | 6 | 12 |
| Kulbäcksliden | 1997 | 18 | 12 | |
| Lillarmsjö | 1998 | 13 | 11 | 13 |
| Gagnet | 1998 | 8 | 8 | 8 |
| Unbyn | 1998 | 8 | 10 | 6 |
| Degerön | 2003 | 9 | 6 | 6 |
| Renfors | 2003 | 10 | 6 | 8 |
| Kulbäcksliden | 2003 | 11 | 6 | 6 |
| Degerön | 2010 | 5 | 3 | |
| Kulbäcksliden | 2010 | 6 | 6 | |
| Total | 126 | 68 | 86 | |
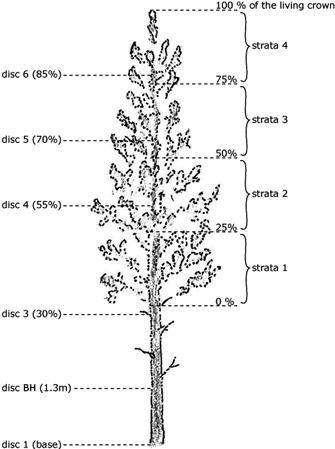
Fig. 2. Biomass sampling tree showing the positions of discs and strata.
| Table 5. The parameter estimates of the compiled biomass models for pine, spruce and birch (ln(kg)). dbh is diameter at breast height (cm) and h is tree height (m). The standard error is given in parentheses. View in new window/tab. |
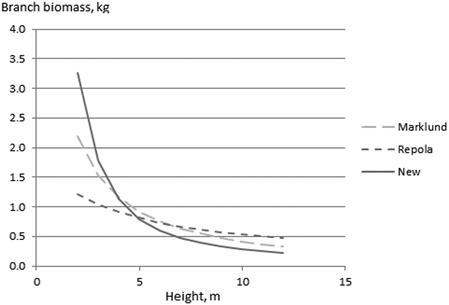
Fig. 3. The effect of tree height on pine branch biomass at a given diameter (6 cm) using the NEW, Marklund (1988) and Repola (2009) biomass models.
| Table 6. The ratio between biomass estimates obtained using the NEW and Marklund’s models (RATIOM) and the NEW and Repola’s models (RATIOR). | ||||||
| Pine | Spruce | Birch | ||||
| RATIOM | RATIOR | RATIOM | RATIOR | RATIOM | RATIOR | |
| Stem | 0.99 | 0.90 | 0.85 | 0.84 | 1.13 | 1.13 |
| Branches | 0.80 | 0.97 | 0.61 | 1.00 | 0.69 | 0.93 |
| Foliage | 1.07 | 1.77 | 1.10 | 1.66 | 17.63 | |
| Total abv. | 0.92 | 0.94 | 0.83 | 0.87 | 0.93 | 1.08 |
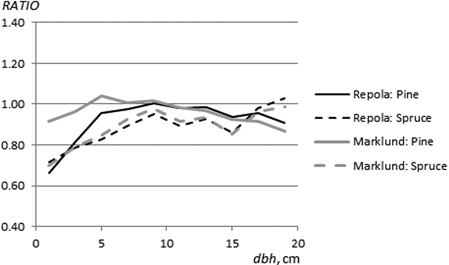
Fig. 4. The ratio between stem biomass estimates (pine and spruce) obtained from the NEW and Marklund’s (1988) models (RATIOM) and the NEW and Repola’s (2008, 2009) models (RATIOR).
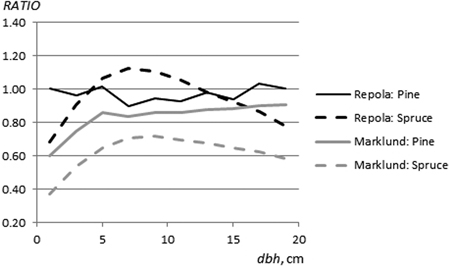
Fig. 5. The ratio between branch biomass estimates (pine and spruce) obtained from the NEW and Marklund’s (1988) models (RATIOM) and the NEW and Repola’s (2008, 2009) models (RATIOR).
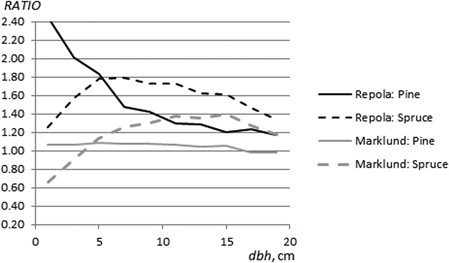
Fig. 6. The ratio between foliage biomass estimates (pine and spruce) obtained using the NEW and Marklund’s (1988) models (RATIOM) and the NEW and Repola’s (2008, 2009) models (RATIOR).
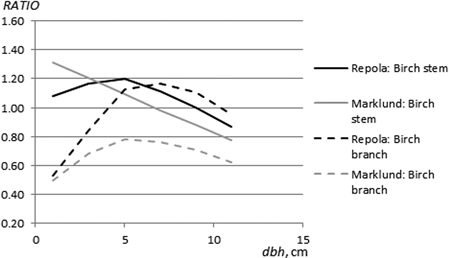
Fig. 7. The ratio between stem and branch biomass estimates (birch) obtained using the NEW and Marklund’s (1988) models (RATIOM) and the NEW and Repola’s (2008, 2009) models (RATIOR).