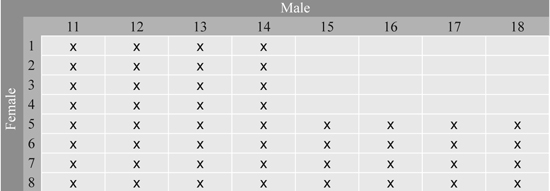
Fig. 1. Full-sib families in Series 1 from the 8 × 8 factorial cross between 16 parents from Svenneby Seed Orchard. The crosses made are denoted by x.
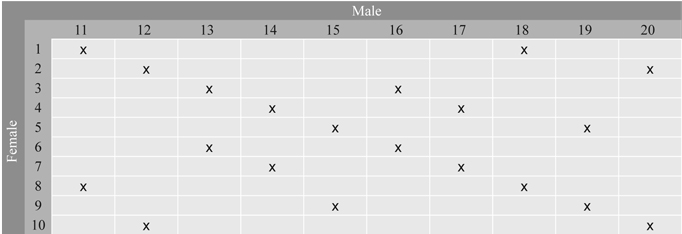
Fig. 2. Full-sib families in Series 2 selected from the 10 × 10 factorial cross between 20 parents from Stange Seed Orchard. Each parent is involved in two crosses. The families are denoted by x.
| Table 1. Results from the analyses of variance presented by variance components and p-values for the factorial cross families at Hoxmark and Nilsrud (Series 1) for height and lesion lengths and heritabilities and type-b genetic correlations, with standard error in parentheses. Flushing was assessed at Hoxmark only. | ||||
| Source | Height | Flushing | Lesion length H. parviporum | Lesion length C. polonica |
| Site | < 0.001 | 0.18 | 0.90 | |
| Female parent | 0.036 (0.03) | 0.033 (0.0002) | 0.0011 (0.14) | 0.018 (0.03) |
| Male parent | 0.050 (0.02) | 0.213 (< 0.0001) | 0.0061 (0.0001) | 0.021 (0.003) |
| Female × male | 0.012 (0.12) | 0.019 (0.0002) | 0.0010 (0.01) | 0.004 (0.10) |
| Sites × female | 0.014 (0.03) | 0.00 (0.32) | 0.006 (0.005) | |
| Site × male | 0.020 (0.02) | 0.00 (0.23) | 0.003 (0.05) | |
| Sites × female × male | 0.027 (< 0.0001) | 0.00 (0.98)) | 0.001 (0.67) | |
| Replicate (site) | 0.158 (< 0.0001) | 0.0013 (< 0.0001) | 0.013 (< 0.0001) | |
| Error | 0.73 | 0.586 | 0.156 | 0.296 |
| Heritability | 0.20 (0.10) | 0.58 (0.20) | 0.13 (0.07) | 0.22 (0.09) |
| Type b correlation | 0.72 (0.18) | 1.00 (0.06) | 0.81 (0.13) | |
| Table 2. Estimates of genetic correlations for the factorial cross families across the two sites in Series 1. | |||
| Flushing 1) | Lesion length H. parviporum | Lesion length C. polonica | |
| Height | –0.54 (0.23) | 0.08 (0.35) | –0.19 (0.34) |
| Flushing1) | 0.03 (0.40) | 0.64 (0.20) | |
| Lesion length H. parviporum | 0.12 (0.30) | ||
| 1) Flushing only assessed at Hoxmark. | |||
| Table 3. Results from the analyses of variance of lesion lengths after inoculations at Svenneby Seed Orchard (six ramets of each clones inoculated six times) (Series 1). | ||
| Source | Variance component | p-value of F-test |
| H. parviporum | ||
| Clone | 0.025 (0.016) | 0.016 |
| Ramet(clone) | 0.034 (0.013) | < 0.0001 |
| Error | 0.109 | |
| C. polonica | ||
| Clone | 0.083 (0.035) | < 0.0001 |
| Ramet(clone) | 0.031 (0.013) | 0.0001 |
| Error | 0.136 | |
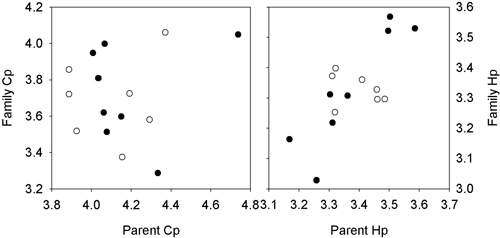
Fig. 3. Plots of the relationship between the breeding value of the female (open dots) and male parents (filled dots) against the mean value of the grafted parent for the lesions length for H. parviporum and C. polonica. Series 1: Svenneby.
| Table 4. Results from the analyses of variance presented by p-values for the each of the two groups of 10 independent full-sib families at Skiptvedt and Ølve (Series 2) for height and lesion lengths. | |||
| Source | Height | Lesion length H. parviporum | Lesion length C. polonica |
| Site | 0.007 0.004 | 0.01 0.0001 | 0.0006 0.38 |
| Family | 0.01 0.10 | 0.02 0.46 | 0.006 0.02 |
| Site × family | 0.l64 0.04 | 0.28 0.16 | 0.28 0.08 |
| Replicate (site) | 0.0003 0.0001 | 0.23 0.003 | 0.54 0.26 |
| Table 5. Results from the analyses of variance of transformed lesion lengths after inoculations at Stange Seed Orchard (four ramets of each clone inoculated four times) (Series 2). | ||
| Source | Variance component | p-value of F-test |
| H. parviporum | ||
| Clone | 0.034 (0.016) | 0.001 |
| Ramet(clone) | 0.025 (0.011) | 0.001 |
| Error | 0.102 | |
| C. polonica | ||
| Clone | 0.111 (0.043) | < 0.0001 |
| Ramet(clone) | 0.049 (0.018) | < 0.0001 |
| Error | 0.124 | |