| Table 1. Mean tree characteristics of each thinning treatment under P. tabulaeformis plantation at establishment: Control (number of trees left equals the average natural density after self-thinning; 2700 trees ha–1), light (1925 trees ha–1), moderate (1325 trees ha–1) and heavy thinning (1125 trees ha–1). | |||||
| Thinning intensity | DBH (cm) | Total tree height (m) | Height under first live branch (m) | Tree canopy width (m) | |
| EW a) | NS b) | ||||
| Control | 11.38 | 6.94 | 3.17 | 3.09 | 2.84 |
| Light | 12.18 | 7.69 | 3.38 | 3.16 | 3.15 |
| Moderate | 13.08 | 8.60 | 4.93 | 3.20 | 3.01 |
| Heavy | 11.75 | 6.81 | 3.18 | 3.00 | 3.75 |
| a) EW = average tree canopy width at east-west direction. b) NS = average tree canopy width at north-south direction. | |||||
| Table 2. Influence of the initial litter N concentration (low N and high N concentration in litter) and thinning intensities (Control, number of trees left equals the average natural density after self-thinning, 2700 trees ha–1; light, 1925 trees ha–1; moderate, 1325 trees ha–1; heavy thinning, 1125 trees ha–1) on litter decomposition rate (expressed as percentage mass loss of the original 50-g sample after one year), N accumulation value, and net release value after one year. | ||||||
| Sources of variation | Mass loss rate | N accumulation value | N net release value | |||
| Mean square | P | Mean square | P | Mean square | P | |
| Initial litter N concentration (I) | 71.595 | <0.001 | 0.039 | <0.001 | 0.037 | <0.001 |
| Thinning intensities (T) | 8.529 | 0.001 | 0.003 | 0.003 | 0.003 | <0.001 |
| I×T | 7.434 | 0.002 | 0.002 | 0.009 | 0.001 | <0.001 |
| Error | 0.925 | <0.001 | <0.001 | |||
| P = significance value. | ||||||
| Table 3. One year decomposition rate (expressed as percentage mass loss of the original 50-g sample after one year) of different initial N concentration litter (litter with low N concentration and litter with high N concentration) affected by the four thinning treatment intensities (Control, number of trees left equals the average natural density after self-thinning, 2700 trees ha–1; light, 1925 trees ha–1; moderate, 1325 trees ha–1; heavy thinning, 1125 trees ha–1). Within each litter type different letters in the same column indicate statistically significant differences according to Duncan’s multiple range test at the 0.05 level. | ||
| Thinning intensity | Mass loss rate (%) of LN a) | Mass loss rate (%) of HN b) |
| Control | 20.57 ± 1.56a | 26.39 ± 0.90b |
| Light | 22.74 ± 0.75b | 23.27 ± 0.72a |
| Moderate | 23.89 ± 0.87b | 27.10 ± 0.84b |
| Heavy | 22.87 ± 0.84b | 27.13 ± 0.97b |
| a) LN = litter with low N concentration. b) HN = litter with high N concentration. | ||
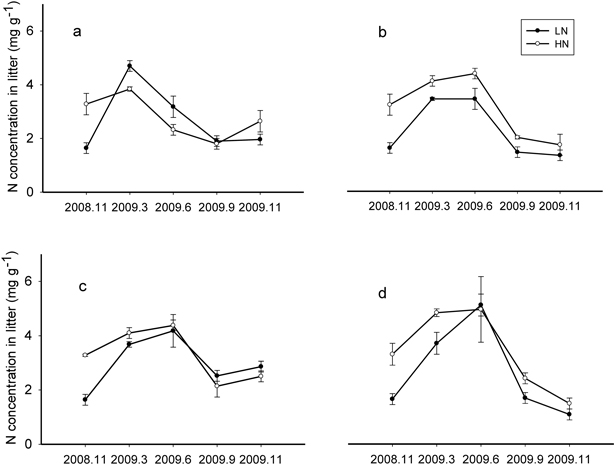
Fig. 1. N concentration changes over time of LN (litter with low N concentration) and HN (litter with high N concentration) decomposition under Control (a) (number of trees left equals the average natural density after self-thinning, 2700 trees ha–1), Light (b) (1925 trees ha–1), Moderate (c) (1325 trees ha–1) and Heavy (d) (1125 trees ha–1) thinning treatment during one year.
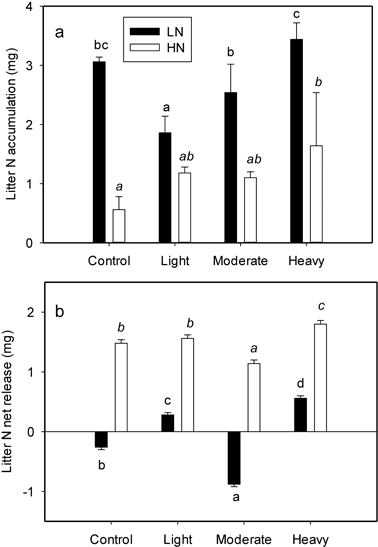
Fig. 2. N accumulation (a) and net release (b) value of per-g LN (litter with low N concentration) and HN (litter with high N concentration) as affected by four thinning treatments (Control, number of trees left equals the average natural density after self-thinning, 2700 trees ha–1; light, 1925 trees ha–1; moderate, 1325 trees ha–1; heavy thinning, 1125 trees ha–1). Within each litter type different letters indicate statistically significant differences according to Duncan’s multiple range test at the 0.05 level.