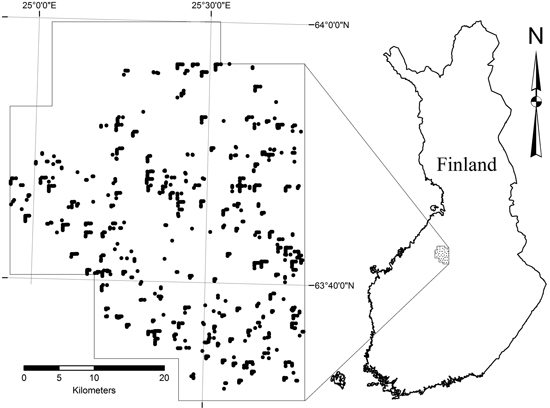
Fig. 1. ALS data coverage and sample plot location.
| Table 1. Predictor candidates (n = 38) derived from ALS data. | |
| Variable name | Variable description |
| h10f – h100f | Point height at the r percentile of the first-echo points’ height distribution (r = 10, 20... 100); ground points, i.e. points below the ground threshold (= 2 m), are excluded. |
| h10l – h100l | Point height at the r percentile of the last-echo points’ height distribution (r = 10, 20... 100); ground points are excluded. |
| penef | Penetration of first-echo points; calculated as the ratio of the number of ground points to the number of all points |
| penel | Penetration of last-echo points |
| HVmean | The mean of the first-echo high-vegetation points, i.e. points above the high vegetation threshold (= 5 m) |
| HVsd | Standard deviation of the Z coordinates for the high vegetation first-echo points |
| pc1l – pc8l | Ratio of the number of last-echo points with heights smaller or equal to hmax to the number of all last-echo points, where hmax = hclassstart + i * hclasssize (i = 1, 2… 8; hclassstart = 1.5 m; hclasssize = 2.0 m) |
| p8530f | Proportional canopy density at a height equalling 30% of the 85th percentile of first-echo points’ height distribution; calculated as the ratio of the number of first-echo points below that height to the number of all first-echo points |
| p8580f | Proportional canopy density at a height equalling 80% of the 85th percentile of first-echo points’ height distribution |
| p9030f | Proportional canopy density at a height equalling 30% of the 90th percentile of first-echo points’ height distribution |
| p9080f | Proportional canopy density at a height equalling 80% of the 90th percentile of first-echo points’ height distribution |
| p9530f | Proportional canopy density at a height equalling 30% of the 95th percentile of first-echo points’ height distribution |
| p9580f | Proportional canopy density at a height equalling 80% of the 95th percentile of first-echo points’ height distribution |
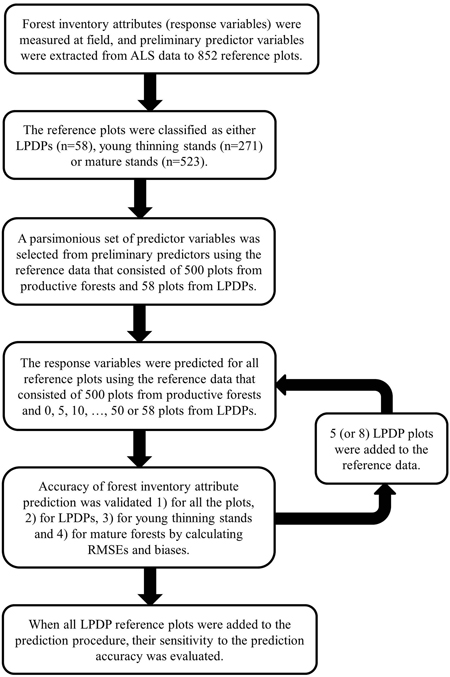
Fig. 2. General workflow of the analysis.
| Table 2. Stand development classes on productive forest land. The classification system and the terminology follow the Finnish Forest Research Institute (2014). | |
| Development class | Definition |
| Young thinning stand | The stands are at a developmental stage where harvesting mostly produces pulpwood. Mean stem DBH is 8–16 cm. |
| Advanced thinning stand | The stands are at a developmental stage and the next forest operation is thinning. Most stems are of saw-timber size, as mean stem DBH is more than 16 cm. |
| Mature stand | The stands are mature and the most profitable forest operation is regeneration cutting. The lower limit for mean stem DBH varies from 23 cm to 29 cm according to location, soil quality and tree species. |
| Table 3. Summary of the reference plot data. | |||
| Forest inventory attribute | Range | Mean | SD |
| Low-productive drained peatlands (n = 58) | |||
| hg, m | 3.8–19.0 | 8.6 | 3.2 |
| dg, cm | 5.5–19.9 | 10.9 | 3.5 |
| N, ha–1 | 79–1690 | 547 | 332 |
| G, m2 ha–1 | 0.2–8.3 | 3.7 | 2.1 |
| V, m3 ha–1 | 0.5–58.7 | 18.7 | 14.2 |
| T, years | 25–122 | 50 | 16 |
| Tree species proportion of total basal area | |||
| Pine (%) | 0–100 | 64 | 44 |
| Spruce (%) | 0–100 | 5 | 19 |
| Deciduous (%) | 0–100 | 31 | 41 |
| Young thinning stands (n = 271) | |||
| hg, m | 6.0–17.7 | 10.6 | 2.1 |
| dg, cm | 7.3–22.8 | 12.3 | 2.5 |
| N, ha–1 | 275–7270 | 1996 | 1071 |
| G, m2 ha–1 | 2.1–29.2 | 14.0 | 5.4 |
| V, m3 ha–1 | 10.6–212.8 | 77.8 | 37.6 |
| T, years | 15–114 | 42 | 18 |
| Tree species proportion of total basal area | |||
| Pine (%) | 0–100 | 57 | 40 |
| Spruce (%) | 0–100 | 17 | 27 |
| Deciduous (%) | 0–100 | 26 | 30 |
| Advanced thinning and mature stands (n = 523) | |||
| hg, m | 10.0–27.8 | 16.9 | 3.0 |
| dg, cm | 11.8–45.0 | 20.5 | 4.6 |
| N, ha–1 | 196–3615 | 1099 | 569 |
| G, m2 ha–1 | 4.6–50.9 | 21.9 | 8.0 |
| V, m3 ha–1 | 32.7–499.2 | 181.9 | 85.7 |
| T, years | 26–153 | 74 | 21 |
| Tree species proportion of total basal area | |||
| Pine (%) | 0–100 | 52 | 38 |
| Spruce (%) | 0–100 | 29 | 34 |
| Deciduous (%) | 0–100 | 19 | 24 |
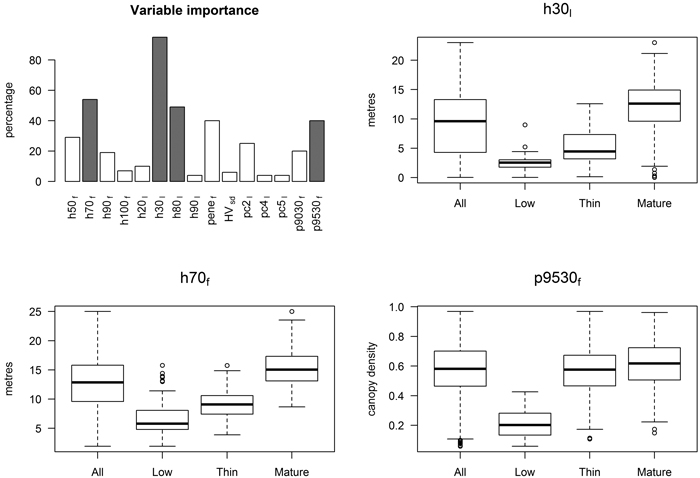
Fig. 3. The importance of 15 candidate predictors (the selected predictors are grey -coloured) and the variation of three selected predictors in LPDPs, thinning and mature forests.
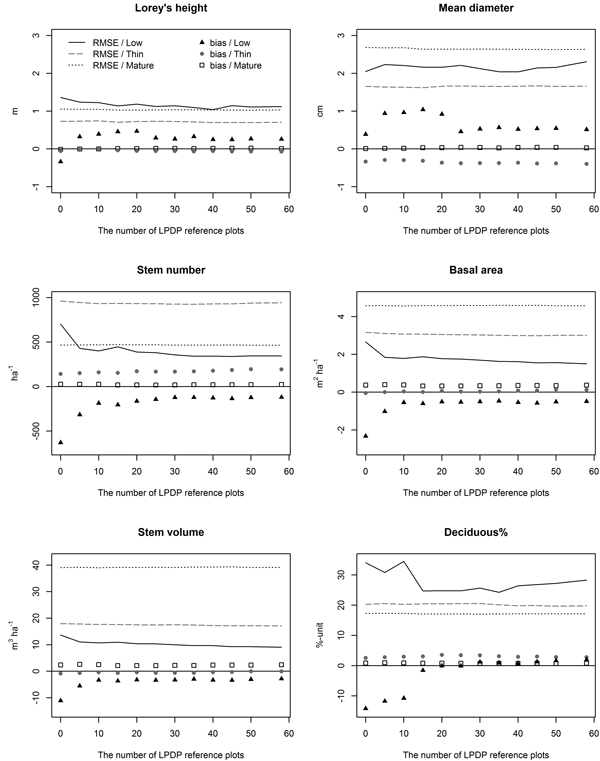
Fig. 4. Estimation accuracy of forest inventory attributes with a varying number of reference plots from LPDPs used in the prediction.
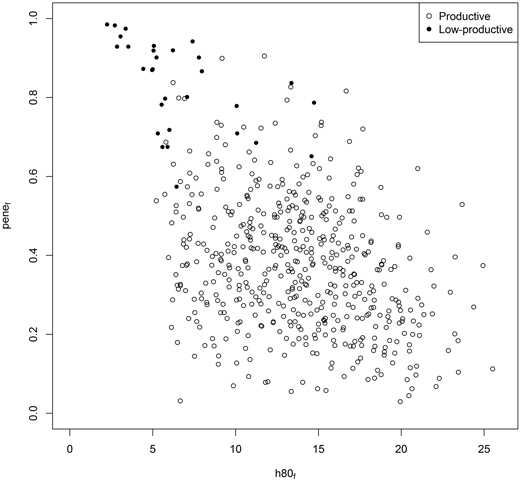
Fig. 5. Allocation of 500 reference plots on productive forest stands and 30 reference plots on LPDPs according to two features extracted from ALS data.
| Table 4. Estimation accuracy of pine- and birch-dominated LPDPs when 30 reference plots from LPDPs were added to the reference data. | ||||
| RMSE | RMSE % | Bias | Bias % | |
| Pine-dominated LPDPs (n = 37) | ||||
| hg, m | 1.0 | 13 | 0.2 | 2.1 |
| dg, cm | 2.1 | 21 | 0.4 | 4.4 |
| N, ha–1 | 298 | 60 | –116 | –23 |
| G, m2 ha–1 | 1.5 | 46 | –0.4 | –12 |
| V, m3 ha–1 | 8.9 | 59 | –2.3 | –15 |
| Birch-dominated LPDPs (n = 18) | ||||
| hg, m | 1.4 | 13 | 0.4 | 4.1 |
| dg, cm | 1.9 | 16 | 0.5 | 4.4 |
| N, ha–1 | 377 | 63 | –133 | –22 |
| G, m2 ha–1 | 2.1 | 46 | –0.7 | –15 |
| V, m3 ha–1 | 12.4 | 49 | –5.2 | –21 |
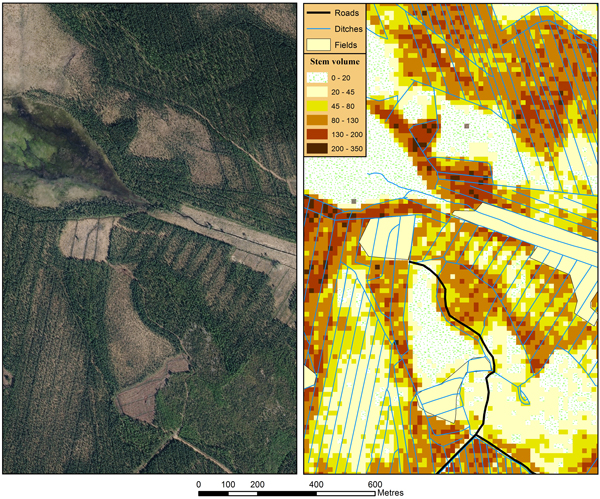
Fig. 6. An aerial photograph (© NLS 2014) and mapped stem volume (m3 ha–1) of the study area.