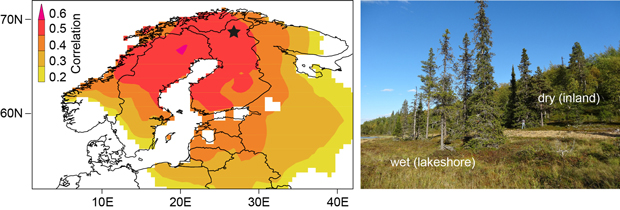
Fig. 1. Sampling area in northern Finland (black star) with the spatial correlation of the spruce chronology with gridded June-July temperatures (CRU TS 3.10, p < 5%) over the 1931–2009 period. The picture on the right side shows the micro-site sampling design. Trees growing at the lakeshore (on the inland slope) with more moist (dry) soil conditions are termed “wet” (“dry”).
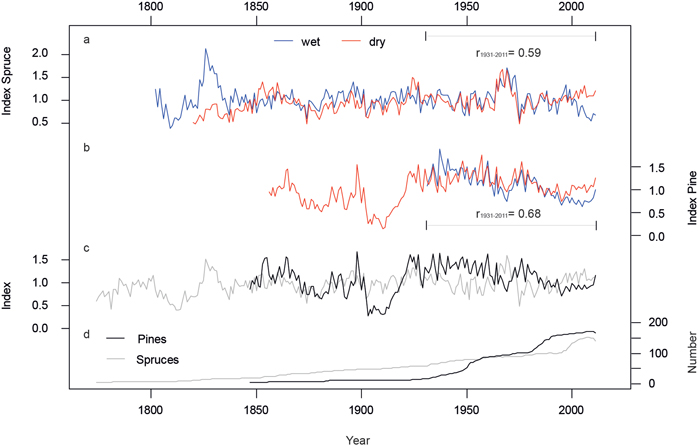
Fig. 2. Micro-site and species specific chronologies after Regional Curve Standardization. a) Spruce chronologies from the wet (blue) and dry (red) micro-sites. b) Same as in a) but for pine. c) Pine (black) and spruce (grey) site chronologies, each including wet and dry trees. d) Numbers of measurement series averaged in the site chronologies. All chronologies were truncated at n < 4. View larger in new window/tab.
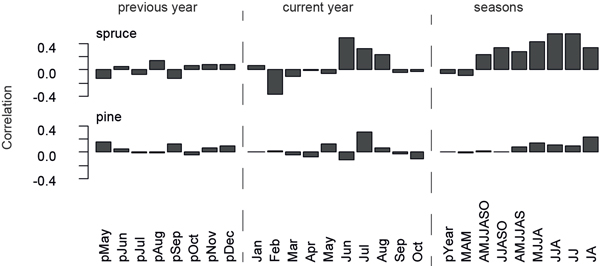
Fig. 3. Correlation of spruce and pine chronologies with temperature data recorded at Sodankylä over the 1931–2011 common period. Correlations are calculated for previous year and current year months, as well as seasonal temperature data.
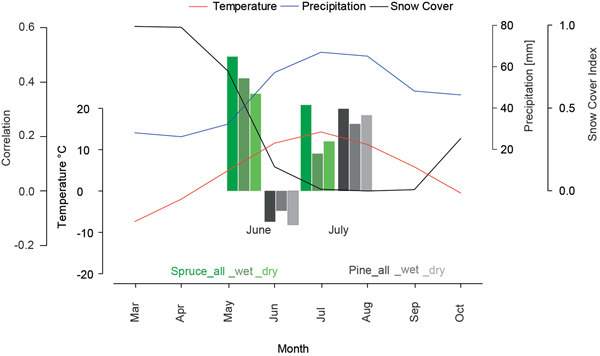
Fig. 4. Monthly mean temperature (red), precipitation (blue) and snow cover (black) for northern Fennoscandia over the 1971–2000 period. Barplot represents correlations of different tree-ring chronologies (site and micro-sites) over the 1931–2011 period with June and July temperatures.
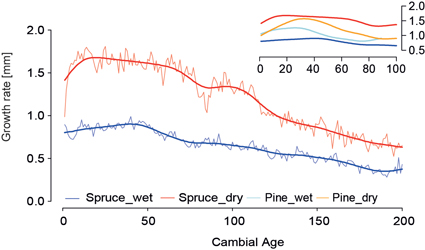
Fig. 5. Age-aligned regional curves and 40-year smoothed mean curves (thick lines) of the spruce micro-site chronologies. Blue (red) represents lakeshore (inland) trees. Regional curves are shown over the first 200 years. Upper panel shows smoothed regional curves of spruce and pine micro-site chronologies for the first 100 years.
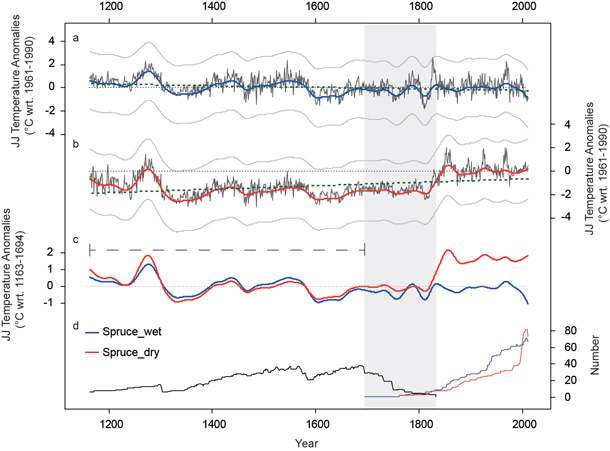
Fig. 6. JJ temperature reconstructions based on long-term spruce chronologies (black). a) Lakeshore wood material (wet) and b) inland (dry) material is used for the living part. The reconstruction extents back to 1163 AD. Low frequency variability of decadal to centennial timescale is displayed by colored lines (50 year spline filter). Green dotted lines show the trend over the last 8 centuries. Uncertainties (+/- standard error) are displayed as error band (grey lines). Thin dotted lines are the 0 °C anomaly level. c) Smoothed JJ temperature reconstructions scaled over the 1163–1694 common period (only relict material; black dashed line). d) Replication of relict (black), living_wet (blue) and living_dry (red) tree ring series. Grey area displays the maximum overlap (1695–1833 period) of the different wood sources.