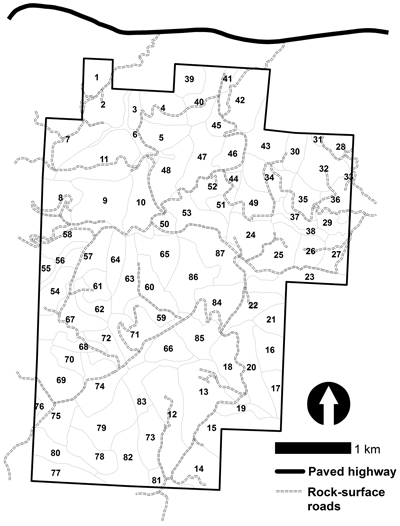
Fig. 1. A map illustrating the layout of stands within the Lincoln Tract in western Oregon (USA).
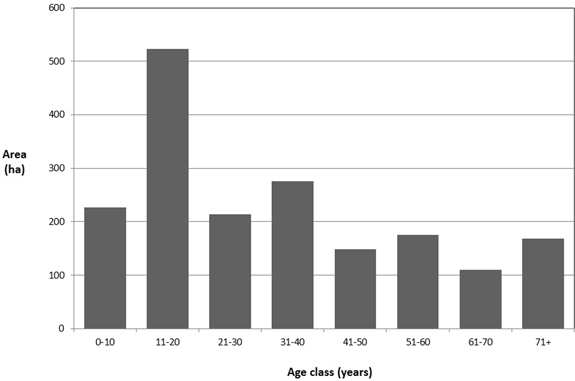
Fig. 2. The age class distribution of the hypothetical dataset.
| Table 1. Threshold accepting instances. | |||||||
| Initial threshold | Iterations per threshold | Threshold change | Unsuccessful iterations per threshold | Reversion interval (iterations)a) | 1-opt moves iterationsb) | 2-opt moves iterationsc) | 3-opt moves iterationsd) |
| 10 000 000 | 10 | 100 | 2000 | 0 | ALL | ||
| 10 000 000 | 10 | 100 | 2000 | 3 | ALL | ||
| 10 000 000 | 10 | 100 | 2000 | 6 | ALL | ||
| 10 000 000 | 10 | 100 | 2000 | 9 | ALL | ||
| 10 000 000 | 10 | 100 | 2000 | 0 | 100 | 10 | |
| 10 000 000 | 10 | 100 | 2000 | 3 | 100 | 10 | |
| 10 000 000 | 10 | 100 | 2000 | 6 | 100 | 10 | |
| 10 000 000 | 10 | 100 | 2000 | 9 | 100 | 10 | |
| 10 000 000 | 10 | 100 | 2000 | 0 | 100 | 10 | 3 |
| 10 000 000 | 10 | 100 | 2000 | 3 | 100 | 10 | 3 |
| 10 000 000 | 10 | 100 | 2000 | 6 | 100 | 10 | 3 |
| 10 000 000 | 10 | 100 | 2000 | 9 | 100 | 10 | 3 |
| a) Reversion intervals: 0 = none, 3 = 1/3, 6 = 1/6, and 9 = 1/9 b) If 2-opt or 3-opt iterations are employed, 1-opt iterations are employed at the end of each of these sets c) 2-opt iterations are employed immediately after each set of 100 1-opt iterations d) 3-opt iterations are employed immediately after each set of 10 2-opt iterations | |||||||
| Table 2. Tabu search instances. | ||||
| Number of iterations | Reversion interval (iterations)a) | 1-opt moves iterationsb) | 2-opt moves iterationsc) | 3-opt moves iterationsd) |
| 1 000 000 | 0 | ALL | ||
| 1 000 000 | 3 | ALL | ||
| 1 000 000 | 6 | ALL | ||
| 1 000 000 | 9 | ALL | ||
| 1 000 000 | 0 | 100 | 10 | |
| 1 000 000 | 3 | 100 | 10 | |
| 1 000 000 | 6 | 100 | 10 | |
| 1 000 000 | 9 | 100 | 10 | |
| 1 000 000 | 0 | 100 | 10 | 3 |
| 1 000 000 | 3 | 100 | 10 | 3 |
| 1 000 000 | 6 | 100 | 10 | 3 |
| 1 000 000 | 9 | 100 | 10 | 3 |
| a) Reversion intervals: 0 = none, 3 = 1/3, 6 = 1/6, and 9 = 1/9 b) If 2-opt or 3-opt iterations are employed, 1-opt iterations are employed at the end of each of these sets c) 2-opt iterations are employed immediately after each set of 100 1-opt iterations d) 3-opt iterations are employed immediately after each set of 10 2-opt iterations | ||||
| Table 3. Results of the s-metaheuristic search processes when applied to the forest management problem. | ||||||
| Search process | Reversion interval (iterations) | Minimum (best) solution value (m3)2 | Maximum (worst) solution value (m3)2 | Average solution value (m3)2 | Standard deviation of solution values (m3)2 | Average time required (seconds) |
| RD | 0 | 74 894 | 37 996 939 | 3 620 631 | 6 199 511 | 37.2 |
| RD | 3 | 768 | 47 142 | 10 285 | 8397 | 39.3 |
| RD | 6 | 858 | 34 429 | 7656 | 6704 | 35.7 |
| RD | 9 | 980 | 32 937 | 10 424 | 7690 | 40.7 |
| TA1 | 0 | 7462 | 18 287 902 | 386 149 | 2 072 861 | 15.5 |
| TA1 | 3 | 1119 | 326 233 | 23 120 | 37 113 | 13.2 |
| TA1 | 6 | 1932 | 98 510 | 19 328 | 17 162 | 14.3 |
| TA1 | 9 | 1270 | 360 189 | 22 140 | 37 102 | 17.4 |
| TA12 | 0 | 13 130 | 136 130 | 62 917 | 26 155 | 17.1 |
| TA12 | 3 | 200 | 21 577 | 4026 | 4271 | 14.7 |
| TA12 | 6 | 323 | 29 963 | 6153 | 5457 | 18.5 |
| TA12 | 9 | 991 | 28 465 | 6994 | 5591 | 18.4 |
| TA123 | 0 | 9923 | 330 688 | 68 858 | 39 769 | 29.2 |
| TA123 | 3 | 173 | 34 262 | 5000 | 5463 | 21.1 |
| TA123 | 6 | 329 | 41 796 | 7590 | 6688 | 24.8 |
| TA123 | 9 | 217 | 61 753 | 9032 | 8971 | 25.7 |
| TS1 | 0 | 969 | 517 278 | 20 692 | 63 162 | 98.6 |
| TS1 | 3 | 217 | 1 959 049 | 73 424 | 323 694 | 106.0 |
| TS1 | 6 | 7.406 | 2 205 650 | 33 171 | 238 905 | 102.0 |
| TS1 | 9 | 19.612 | 11 248 | 1158 | 2077 | 112.3 |
| TS12 | 0 | 27.029 | 674 | 329 | 139 | 212.0 |
| TS12 | 3 | 3.625 | 4082 | 206 | 496 | 218.1 |
| TS12 | 6 | 0.078 | 746 | 42 | 111 | 222.3 |
| TS12 | 9 | 0.150 | 440 | 24 | 56 | 225.5 |
| TS123 | 0 | 23.057 | 690 | 323 | 145 | 2219.1 |
| TS123 | 3 | 2.979 | 5273 | 223 | 596 | 2137.1 |
| TS123 | 6 | 0.395 | 462 | 38 | 78 | 2249.5 |
| TS123 | 9 | 0.262 | 251 | 24 | 50 | 2102.4 |
| (m3)2 = Cubic meters of harvest volume squared, the objective function unit value RD = Raindrop method TA1 = Threshold accepting with 1-opt moves only TA12 = Threshold accepting with 1-opt and 2-opt moves TA123 = Threshold accepting with 1-opt, 2-opt and 3-opt moves TS1 = Tabu search with 1-opt moves only TS12 = Tabu search with 1-opt and 2-opt moves TS123 = Tabu search with 1-opt, 2-opt and 3-opt moves Reversion intervals: 0 = none, 3 = 1/3, 6 = 1/6, and 9 = 1/9 | ||||||