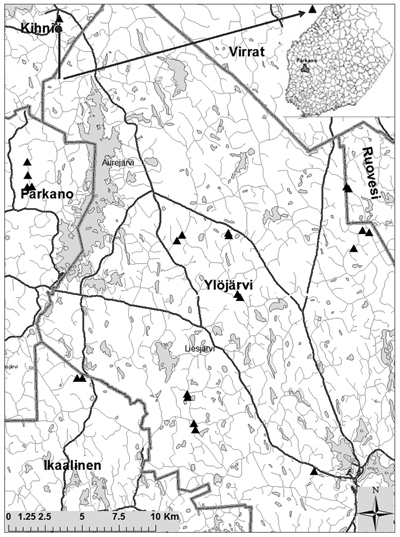
Fig. 1. Test road sections located nearby Parkano. Triangle symbols stand for location and lines stand for road. Two of test road sections located outside of map. A thin grey line indicates low volume road network.
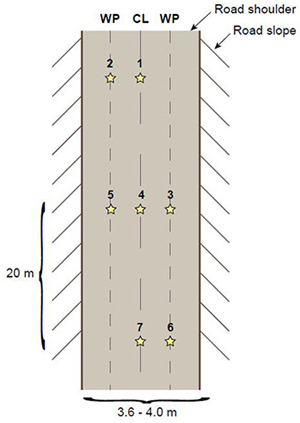
Fig. 2. Location of measurement points (star-symbol) along the test road section. Numbers 1–7 denote the measurement points, WP stands for wheel path and CL stands for centre line.
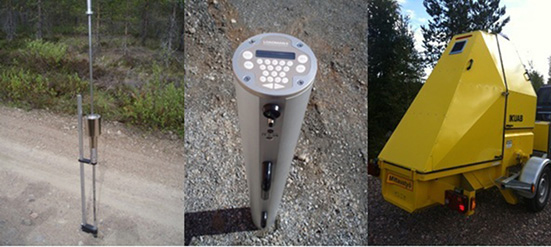
Fig. 3. Test devices, dynamic penetrometer (DCP), Loadman (LFWD) and falling weight deflectometer (FWD).
| Table 1. Summary of measuring devices is used in the study by test road, subgrade type and measurement round. The test roads rehabilitated during the study are shown on two consecutive rows with “a” denoting original road structure and “b” denoting rehabilitated road structure. “L” stands for the Loadman, “D” for the dynamic cone penetrometer and “F” for the falling weight deflectometer. | ||||||||
| Test road No. | Subgrade | Measurement round | ||||||
| Spring 2009 | Summer 2009 | Spring 2010 | Spring 2011 | Spring 2012 | Numbers of rounds | |||
| L, D | F | |||||||
| 41 | Mineral | L, D, F | L, D | L, D | L, D | L, D, F | 5 | 2 |
| 61 | Mineral | L, D, F | L, D | L, D | L, D | L, D, F | 5 | 2 |
| 71a | Mineral | L, D, F | L, D | L, D | 3 | 1 | ||
| 71b | L, D | L, D, F | 2 | 1 | ||||
| 111 | Mineral | L, D, F | L, D | L, D | L, D | L, D, F | 5 | 2 |
| 121 | Mineral | L, D, F | L, D | L, D | L, D | L, D, F | 5 | 2 |
| 131a | Mineral | L, D | 1 | |||||
| 131b | L, D | L, D, F | 2 | 1 | ||||
| 151 | Mineral | L, D, F | L, D | L, D | L, D | L, D, F | 5 | 2 |
| 211 | Mineral | L, D | L, D, F | 2 | 1 | |||
| 511a | Mineral | L, D, F | L, D | L, D | 3 | 1 | ||
| 511b | L, D | L, D, F | 2 | 1 | ||||
| 521a | Mineral | L, D, F | L, D | 2 | 1 | |||
| 521b | L, D | L, D, F | 2 | 1 | ||||
| Subtotal | 44 | 18 | ||||||
| 40 | Peat | L, D, F | L, D | L, D | L, D | L, D, F | 5 | 2 |
| 60a | Peat | L, D, F | L, D | L, D | 3 | 1 | ||
| 60b | L, D | L, D, F | 2 | 1 | ||||
| 70a | Peat | L, D, F | L, D | L, D | 3 | 1 | ||
| 70b | L, D | L, D, F | 2 | 1 | ||||
| 110a | Peat | L, D, F | L, D | L, D | 3 | 1 | ||
| 110b | L, D | L, D, F | 2 | 1 | ||||
| 120 | Peat | L, D, F | L, D | L, D | L, D | L, D, F | 5 | 2 |
| 140 | Peat | L, D | 1 | 0 | ||||
| 150 | Peat | L, D, F | L, D | L, D | L, D | L, D, F | 5 | 2 |
| 160 | Peat | L, D | 1 | 0 | ||||
| 200a | Peat | L, D | 1 | 0 | ||||
| 200b | L, D, F | 1 | 1 | |||||
| 210 | Peat | L, D | L, D, F | 2 | 1 | |||
| 250a | Peat | L, D, F | L, D | L, D | 3 | 1 | ||
| 250b | L, D | L, D, F | 2 | 1 | ||||
| 260 | Peat | L, D, F | L, D | L, D | L, D | L, D, F | 5 | 2 |
| 510a | Peat | L, D, F | L, D | L, D | 3 | 1 | ||
| 510b | L, D | L, D, F | 2 | 1 | ||||
| 520a | Peat | L, D | 1 | 0 | ||||
| 520b | L, D | L, D, F | 2 | 1 | ||||
| Subtotal | 54 | 21 | ||||||
| Total | 98 | 39 | ||||||
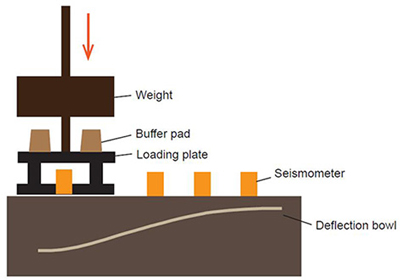
Fig. 4. Operating principle of falling weight deflectometer (Spoof and Petäjä 2000).
| Table 2. Mean, minimum and maximum thicknesses and grain size distributions (GSD) of road structural layers. | ||||||
| Thickness of aggregate layer, cm | Thickness of embankment fill, cm | Thickness of peat, cm | Aggregate layer EGSD, MPa | Embankment fill EGSD, MPa | Subgrade EGSD, MPa | |
| Mineral | ||||||
| Mean | 24 | 37 | 138 | 49 | 31 | |
| N | 8 | 8 | 8 | 8 | 8 | |
| Min | 6 | 11 | 50 | 15 | 15 | |
| Max | 32 | 55 | 200 | 70 | 50 | |
| Peat | ||||||
| Mean | 23 | 51 | 145 | 147 | 66 | |
| N | 10 | 13 | 5 | 10 | 11 | |
| Min | 13 | 11 | 70 | 15 | 15 | |
| Max | 43 | 86 | 185 | 200 | 200 | |
| Table 3. Mean volumetric water content (VWC) and ground water table (GWT) by test road section and time of measurement round. N stands for number of measurements by VWC device. | ||||||||||||
| Test road N:o | Subgrade | Spring 2009 | Spring 2009 | Spring 2010 | Spring 2011 | Spring 2012 | ||||||
| VWC | VWC | VWC | GWT | VWC | GWT | GWT | ||||||
| Mean (std. dev.) | N | Mean (std. dev.) | N | Mean (std. dev.) | N | Mean (std. dev.) | N | |||||
| 41 | Mineral | 6 (0) | 3 | 11 (0) | 3 | 15 (0) | 3 | 65 | 9 (1) | 3 | 75 | 55 |
| 61 | Mineral | 9 (1) | 3 | 6 (1) | 3 | 22 (4) | 3 | 178 | 179 | 181 | ||
| 71a | Mineral | 16 (2) | 3 | 14 (2) | 3 | 18 (2) | 3 | 124 | ||||
| 71b | Mineral | 130 | 120 | |||||||||
| 111 | Mineral | 17 (2) | 3 | 13 (3) | 19 (3) | 3 | 93 | 93 | 82 | |||
| 121 | Mineral | 13 (2) | 3 | 7 (3) | 3 | 13 (2) | 3 | 67 | 11 (0) | 3 | 71 | |
| 131a | Mineral | 22 (09 | 3 | |||||||||
| 131b | Mineral | 17 (1) | 3 | 103 | 60 | |||||||
| 151 | Mineral | 12 (2) | 3 | 12 (2) | 3 | 18 (1) | 3 | 92 | 17 (1) | 3 | 67 | 66 |
| 211 | Mineral | |||||||||||
| 511a | Mineral | 16 (6) | 3 | 13 (3) | 3 | 16 (2) | 3 | 222 | ||||
| 511b | Mineral | 5 (0) | 3 | 136 | ||||||||
| 521a | Mineral | 21 (2) | 3 | 110 | ||||||||
| 521b | Mineral | 8 (2) | 3 | 107 | ||||||||
| 40 | Peat | 7 (1) | 3 | 12 (1) | 3 | 13 (2) | 3 | 72 | 15 (0) | 3 | 73 | 65 |
| 60a | Peat | 12 (0) | 3 | 8 (1) | 3 | 22 | ||||||
| 60b | Peat | 58 | ||||||||||
| 70a | Peat | 10 (3) | 3 | 16 (4) | 3 | 18 (2) | 3 | |||||
| 70b | Peat | 82 | 72 | |||||||||
| 110a | Peat | 16 (2) | 3 | 13 (2) | 3 | 17 (3) | 3 | 60 | ||||
| 110b | Peat | 11 (2) | 3 | 53 | 46 | |||||||
| 120 | Peat | 16 (0) | 3 | 11 (1) | 3 | 18 (2) | 3 | 73 | 11 (0) | 3 | 73 | |
| 140 | Peat | 21 (1) | 3 | |||||||||
| 150 | Peat | 12 (2) | 3 | 16 (3) | 3 | 15 (2) | 3 | 71 | 7 (2) | 3 | 72 | 64 |
| 160 | Peat | |||||||||||
| 200a | Peat | |||||||||||
| 200b | Peat | 48 | ||||||||||
| 210 | Peat | 102 | 94 | |||||||||
| 250a | Peat | 3 (0) | 3 | 6 (1) | 3 | 22 (4) | 3 | 57 | ||||
| 250b | Peat | 65 | 82 | |||||||||
| 260 | Peat | 6 (1) | 3 | 8 (2) | 3 | 16 (1) | 3 | 57 | 44 | |||
| 510a | Peat | 14 (4) | 3 | 13 (3) | 3 | 21 (2) | 3 | 56 | ||||
| 510b | Peat | 6 (0) | 3 | 217 | 42 | |||||||
| 520a | Peat | 22 (1) | 3 | |||||||||
| 520b | Peat | 14 (1) | 3 | 48 | 32 | |||||||
| Table 4. Means (and standard deviations) of stiffnesses at all measurement points measured with the Loadman (ELFWD), dynamic cone penetrometer (EDCP) and falling weight deflectometer (EFWD) classified by measurement classes wheel path (WP) and centre line (CL) and measurement round of test road sections over a mineral subgrade. | ||||||||||||
| Mineral | WP | CL | ||||||||||
| ELFWD, Mpa | EDCP, MPa | EFWD, MPa | ELFWD, MPa | EDCP, MPa | EFWD, MPa | |||||||
| Mean (std. dev.) | N | Mean (std. dev.) | N | Mean (std. dev.) | N | Mean (std. dev.) | N | Mean (std. dev.) | N | Mean (std. dev.) | N | |
| Spring 2009 | 97 (28) | 32 | 132 (27) | 28 | 56 (22) | 8 | 45 (12) | 23 | 86 (27) | 21 | ||
| Spring 2010 | 63 (23) | 38 | 106 (28) | 30 | 35 (10) | 27 | 81 (15) | 21 | ||||
| Spring 2011 | 66 (25) | 42 | 124 (45) | 42 | 35 (11) | 30 | 76 (15) | 30 | ||||
| Spring 2012 | 54 (21) | 41 | 101 (24) | 42 | 49 (16) | 19 | 32 (12) | 30 | 79 (20) | 30 | 28 (9) | 10 |
| Average | 70 (24) | 116 (31) | 53 (19) | 37 (11) | 81 (19) | 26 | 28 (9) | |||||
| Summer 2009 | 113 (31) | 28 | 159 (50) | 28 | 57 (22) | 21 | 94 (33) | 21 | ||||
| Table 5. Means (and standard deviations) of stiffnesses at all measurement points measured with the Loadman (ELFWD) and dynamic cone penetrometer (EDCP) classified by measurement classes wheel path (WP) and centre line (CL) and measurement round of roads over a peat subgrade. | ||||||||||||
| Peat | WP | CL | ||||||||||
| ELFWD, MPa | EDCP, MPa | EFWD, MPa | ELFWD, MPa | EDCP, MPa | EFWD, MPa | |||||||
| Mean (std. dev.) | N | Mean (std. dev.) | N | Mean (std. dev.) | N | Mean (std. dev.) | N | Mean (std. dev.) | N | Mean (std. dev.) | N | |
| Spring 2009 | 103 (24) | 36 | 144 (19) | 34 | 47 (25) | 10 | 49 (17) | 26 | 94 (36) | 27 | ||
| Spring 2010 | 63 (18) | 52 | 122 (28) | 45 | 43 (21) | 39 | 92 (21) | 36 | ||||
| Spring 2011 | 85 (21) | 44 | 146 (43) | 36 | 40 (14) | 33 | 95 (33) | 27 | ||||
| Spring 2012 | 65 (25) | 48 | 127 (34) | 48 | 46 (19) | 24 | 34 (14) | 36 | 91 (28) | 35 | 29 (11) | 12 |
| Average | 79 (22) | 135 (31) | 47 (22) | 42 (17) | 93 (30) | 29 (11) | ||||||
| Summer 2009 | 113 (24) | 36 | 173 (38) | 36 | 55 (23) | 27 | 109 (40) | 27 | ||||
| Table 6a. Correlation coefficients between stiffnesses measured with the Loadman (ELFWD), dynamic cone penetrometer (EDCP) and falling weight deflectometer (EFWD) classified by measurement classes wheel path (WP) and centre line (CL) on test roads over a mineral subgrade. P-values and the number of observations are given in the rows below the coefficient. Values in bold indicate that the calculated correlation is statistically significant (P-value < 0.05). | ||||||
| Mineral | WP | CL | ||||
| EDCP | EFWD | EDCP | EFWD | VWC | ||
| WP | ELFWD | 0.707 | 0.572 | |||
| 0.000 | 0.002 | |||||
| 169 | 26 | |||||
| EDCP | 0.559 | |||||
| 0.003 | ||||||
| 26 | ||||||
| CL | ELFWD | 0.458 | 0.635 | –0.412 | ||
| 0.000 | 0.049 | 0.000 | ||||
| 123 | 10 | 90 | ||||
| EDCP | 0.599 | –0.291 | ||||
| 0.067 | 0.007 | |||||
| 10 | 84 | |||||
| Table 6b. Correlation coefficients between stiffnesses measured with the Loadman (ELFWD), dynamic cone penetrometer (EDCP) and falling weight deflectometer (EFWD) classified by measurement classes wheel path (WP) and centre line (CL) on test roads over a peat subgrade. P-values and the number of observations are given in the rows below the coefficient. Values in bold indicate that the calculated correlation is statistically significant (P-value < 0.05). | ||||||
| Peat | WP | CL | ||||
| EDCP | EFWD | EDCP | EFWD | VWC | ||
| WP | ELFWD | 0.591 | 0.441 | |||
| 0.000 | 0.010 | |||||
| 199 | 33 | |||||
| EDCP | 0.307 | |||||
| 0.082 | ||||||
| 33 | ||||||
| CL | ELFWD | 0.462 | 0.912 | –0.267 | ||
| 0.000 | 0.000 | 0.000 | ||||
| 274 | 12 | 191 | ||||
| EDCP | 0.349 | –0.400 | ||||
| 0.266 | 0.063 | |||||
| 12 | 180 | |||||
| Table 7a. Correlation coefficients between stiffnesses measured with the Loadman (ELFWD), dynamic cone penetrometer (EDCP), dynamic cone penetrometer measurement from surface layer (EDCP 0–300) and surface deflection values of falling weight deflectometer at various radial distances classified by wheel path (WP) and centre line (CL) on the mineral subgrade. P-values and the number of observations are given in the rows below the coefficient. Values in bold indicate that the calculated correlation is statistically significant (P-value < 0.05). | |||||||||
| Mineral | WP | CL | |||||||
| SCI 200 | SCI 300 | D 300–450 | D 450–600 | SCI 200 | SCI 300 | D 300–450 | D 450–600 | ||
| WP | ELFWD | –0.574 | –0.636 | –0.371 | –0.179 | ||||
| 0.002 | 0.000 | 0.062 | 0.381 | ||||||
| 26 | 26 | 26 | 26 | ||||||
| EDCP | –0.624 | –0.670 | –0.337 | –0.222 | |||||
| 0.001 | 0.000 | 0.093 | 0.276 | ||||||
| 26 | 26 | 26 | 26 | ||||||
| CL | ELFWD | 0.046 | –0.324 | –0.402 | –0.592 | ||||
| 0.900 | 0.361 | 0.250 | 0.072 | ||||||
| 10 | 10 | 10 | 10 | ||||||
| EDCP | –0.136 | –0.708 | –0.341 | –0.633 | |||||
| 0.708 | 0.022 | 0.335 | 0.049 | ||||||
| 10 | 10 | 10 | 10 | ||||||
| EDCP 0–300 | –0.048 | –0.755 | –0.481 | –0.640 | |||||
| 0.896 | 0.012 | 0.159 | 0.046 | ||||||
| 10 | 10 | 10 | 10 | ||||||
| EDCP 300- | –0.188 | –0.734 | –0.245 | –0.260 | |||||
| 0.603 | 0.016 | 0.495 | 0.469 | ||||||
| 10 | 10 | 10 | 10 | ||||||
| Table 7b. Correlation coefficients between stiffnesses measured with the Loadman (ELFWD), dynamic cone penetrometer (EDCP), dynamic cone penetrometer measurement from surface layer (EDCP 0–300) and surface deflection values of falling weight deflectometer at various radial distances classified by wheel path (WP) and centre line (CL) on the peat subgrade. P-values and the number of observations are given in the rows below the coefficient. Values in bold indicate that the calculated correlation is statistically significant (P-value < 0.05). | |||||||||
| Peat | WP | CL | |||||||
| SCI 200 | SCI 300 | D 300–450 | D 450–600 | SCI 200 | SCI 300 | D 300–450 | D 450–600 | ||
| WP | ELFWD | –0.503 | –0.470 | –0.183 | –0.095 | ||||
| 0.003 | 0.006 | 0.307 | 0.599 | ||||||
| 32 | 33 | 33 | 33 | ||||||
| EDCP | –0.403 | –0.503 | 0.057 | 0.013 | |||||
| 0.022 | 0.003 | 0.752 | 0.942 | ||||||
| 32 | 33 | 33 | 33 | ||||||
| CL | ELFWD | –0.173 | –0.636 | –0.554 | –0.375 | ||||
| 0.590 | 0.026 | 0.062 | 0.230 | ||||||
| 12 | 12 | 12 | 12 | ||||||
| EDCP | 0.366 | –0.391 | –0.564 | –0.230 | |||||
| 0.242 | 0.209 | 0.056 | 0.471 | ||||||
| 12 | 12 | 12 | 12 | ||||||
| EDCP 0–300 | 0.042 | –0.590 | –0.114 | –0.163 | |||||
| 0.896 | 0.043 | 0.725 | 0.612 | ||||||
| 12 | 12 | 12 | 12 | ||||||
| EDCP 300- | 0.200 | –0.030 | 0.019 | 0.070 | |||||
| 0.534 | 0.926 | 0.829 | 0.829 | ||||||
| 11 | 12 | 12 | 12 | ||||||
| Table 8a. Correlation coefficients between stiffnesses measured with the Loadman, dynamic cone penetrometer and Falling weight Deflectometer and corresponding stiffnesses derived from soil samples from the mineral subgrade. EGSD refer to elastic modulus estimations based on grain size distributions. WP stands for wheel path and CL stands for centre line. P-values and the number of observations are given in the rows below the coefficient. Values in bold indicate that the calculated correlation is statistically significant (P-value < 0.05) or strong (>0.400). | |||||||
| Mineral | WP | CL | |||||
| ELFWD | EDCP | EFWD | ELFWD | EDCP | EFWD | ||
| WP | Aggregate EGSD | 0.351 | 0.199 | 0.367 | |||
| 0.049 | 0.275 | 0.179 | |||||
| 32 | 32 | 15 | |||||
| Embankment fill EGSD | –0.413 | –0.558 | –0.300 | ||||
| 0.014 | 0.000 | 0.241 | |||||
| 35 | 36 | 17 | |||||
| Subgrade EGSD | 0.019 | –0.112 | 0.354 | ||||
| 0.923 | 0.570 | 0.215 | |||||
| 27 | 28 | 14 | |||||
| CL | Aggregate EGSD | 0.415 | –0.212 | –0.196 | |||
| 0.044 | 0.320 | 0.642 | |||||
| 24 | 24 | 8 | |||||
| Embankment fill EGSD | –0.479 | –0.107 | –0.101 | ||||
| 0.012 | 0.596 | 0.797 | |||||
| 27 | 27 | 9 | |||||
| Subgrade EGSD | 0.201 | 0.449 | 0.652 | ||||
| 0.382 | 0.041 | 0.113 | |||||
| 21 | 21 | 7 | |||||
| Table 8b. Correlation coefficients between stiffnesses measured with the Loadman, dynamic cone penetrometer and Falling weight Deflectometer and corresponding stiffnesses derived from soil samples from the peat subgrade. EGSD refer to Elastic modulus estimations based on grain size distributions. WP stands for wheel path and CL stands for centre line. P-values and the number of observations are given in the rows below the coefficient. Values in bold indicate that the calculated correlation is statistically significant (P-value < 0.05) or strong (>0.400). | |||||||
| Peat | WP | CL | |||||
| ELFWD | EDCP | EFWD | ELFWD | EDCP | EFWD | ||
| WP | Aggregate EGSD | 0.248 | 0.172 | 0.101 | |||
| 0.123 | 0.288 | 0.673 | |||||
| 40 | 40 | 20 | |||||
| Embankment fill EGSD | 0.321 | 0.537 | 0.147 | ||||
| 0.033 | 0.000 | 0.514 | |||||
| 44 | 44 | 22 | |||||
| CL | Aggregate EGSD | 0.091 | 0.214 | 0.026 | |||
| 0.632 | 0.256 | 0.943 | |||||
| 30 | 30 | 10 | |||||
| Embankment fill EGSD | 0.346 | 0.561 | 0.417 | ||||
| 0.048 | 0.001 | 0.202 | |||||
| 33 | 32 | 11 | |||||
| Table 9a. Correlation coefficients between deflection bowl indices measured by the falling weight deflectometer and Elastic modulus of grain size distribution derived stiffnesses of mineral subgrade. WP stands for wheel path and CL stands for centre line. P-values and the number of observations are given in the rows below the coefficient. Values in bold indicate that the calculated correlation is statistically significant (P-value < 0.05). | |||||||||
| Mineral | WP | CL | |||||||
| SCI 200 | SCI 300 | D 300–450 | D 450–600 | SCI 200 | SCI 300 | D 300–450 | D 450–600 | ||
| WP | Aggregate EGSD | 0.004 | 0.028 | –0.045 | –0.011 | ||||
| 0.986 | 0.898 | 0.840 | 0.960 | ||||||
| 23 | 23 | 23 | 23 | ||||||
| Embankment fill EGSD | 0.332 | 0.249 | 0.172 | –0.300 | |||||
| 0.121 | 0.251 | 0.432 | 0.164 | ||||||
| 23 | 23 | 23 | 23 | ||||||
| Subgrade EGSD | –0.038 | –0.098 | –0.175 | –0.277 | |||||
| 0.874 | 0.679 | 0.460 | 0.238 | ||||||
| 20 | 20 | 20 | 20 | ||||||
| CL | Aggregate EGSD | 0.206 | –0.072 | 0.443 | 0.436 | ||||
| 0.625 | 0.866 | 0.271 | 0.280 | ||||||
| 8 | 8 | 8 | 8 | ||||||
| Embankment fill EGSD | –0.912 | –0.013 | –0.769 | –0.067 | |||||
| 0.002 | 0.975 | 0.026 | 0.875 | ||||||
| 8 | 8 | 8 | 8 | ||||||
| Subgrade EGSD | –0.567 | 0.106 | –0.683 | –0.748 | |||||
| 0.184 | 0.820 | 0.091 | 0.053 | ||||||
| 7 | 7 | 7 | 7 | ||||||
| Table 9b. Correlation coefficients between deflection bowl indices measured by the falling weight deflectometer and Elastic modulus of grain size distribution derived stiffnesses of peat subgrade. WP stands for wheel path and CL stands for centre line. P-values and the number of observations are given in the rows below the coefficient. Values in bold indicate that the calculated correlation is statistically significant (P-value < 0.05) | |||||||||
| Peat | WP | CL | |||||||
| SCI 200 | SCI 300 | D 300–450 | D 450–600 | SCI 200 | SCI 300 | D 300–450 | D 450–600 | ||
| WP | Aggregate EGSD | –0.314 | –0.323 | –0.055 | –0.092 | ||||
| 0.098 | 0.081 | 0.772 | 0.629 | ||||||
| 29 | 30 | 30 | 30 | ||||||
| Embankment fill EGSD | –0.474 | –0.400 | 0.181 | 0.206 | |||||
| 0.007 | 0.024 | 0.322 | 0.258 | ||||||
| 31 | 32 | 32 | 32 | ||||||
| CL | Aggregate EGSD | 0.181 | –0.089 | –0.292 | –0.646 | ||||
| 0.617 | 0.806 | 0.413 | 0.043 | ||||||
| 10 | 10 | 10 | 10 | ||||||
| Embankment fill EGSD | –0.246 | –0.804 | –0.187 | –0.133 | |||||
| 0.465 | 0.003 | 0.581 | 0.696 | ||||||
| 11 | 11 | 11 | 11 | ||||||
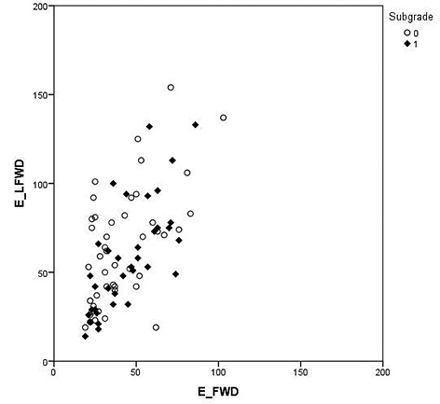
Fig. 5. Comparison of the Loadman (LFWD) and falling weight deflectometer (FWD) results classified by subgrade type: peat (0) and mineral (1). The Elastic modulus for Loadman and falling weight deflectometer are called ELFWD and EFWD, respectively.
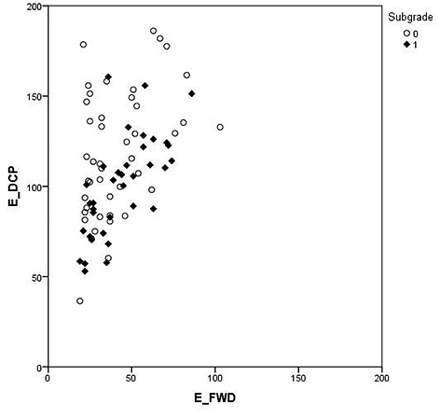
Fig. 6. Comparison of the dynamic cone penetrometer (DCP) and falling weight deflectometer (FWD) results classified by subgrade type: peat (0) and mineral (1). The elastic modulus for DCP and FWD are called EDCP and EFWD, respectively.
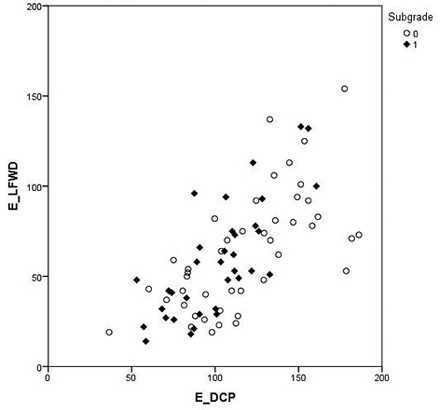
Fig. 7. Comparison of the Loadman (LFWD) and dynamic cone penetrometer (DCP) results classified by subgrade type: peat (0) and mineral (1). The Elastic modulus for Loadman and DCP are called ELFWD and EDCP, respectively.
| Table 10. Regression model predicted Elastic modulus for the falling weight deflectometer (EFWD) from Loadman (ELFWD) and dynamic cone penetrometer (EDCP) of roads built on peat subgrade soils. N = 44. SE stands for standard error. | ||||||||
| Model | 1 | 2 | 3 | 4 | ||||
| Parameter | Estimate (SE) | Sig. | Estimate (SE) | Sig. | Estimate (SE) | Sig. | Estimate (SE) | Sig. |
| Intercept | 18.9 (5.5) | 0.001 | 41.5 (9.2) | <0.001 | 11.9 (9.9) | 0.236 | 20.1 (16.3) | 0.231 |
| ELFWD | 0.352 (0.077) | <0.001 | 0.369 (0.084) | <0.001 | ||||
| EDCP | 0.248 (0.080) | 0.003 | 0.397 (0.123) | 0.004 | ||||
| ThicknessAggregate | –0.969 (0.266) | 0.001 | –1.12 (0.304) | 0.001 | ||||
| R2 | 0.327 | 0.596 | 0.183 | 0.487 | ||||
| Table 11. Regression models predicting Elastic modulus for the FWD (EFWD) from Loadman (ELFWD) and DCP (EDCP) of roads built on mineral subgrade soils. N = 35. SE stands for standard error. | ||||
| Model | 1 | 2 | ||
| Parameter | Estimate (SE) | Sig. | Estimate (SE) | Sig. |
| Intercept | 19.5 (4.8) | <0.001 | –0.7 (8.5) | 0.931 |
| ELFWD | 0.432 (0.073) | <0.001 | ||
| EDCP | 0.443 (0.082) | <0.001 | ||
| R2 | 0.508 | 0.596 | ||
| Table 12. Regression models predicting Elastic modulus for the Loadman (ELFWD) based on DCP measurements (EDCP) on roads built on peat and mineral subgrade soils. N = 35. SE stands for standard error. | ||||
| Model | Peat | Mineral | ||
| Parameter | Estimate (SE) | Sig. | Estimate (SE) | Sig. |
| Intercept | –10.8 (13.2) | 0.417 | –30.6 (13.8) | 0.033 |
| EDCP | 0.629 (0.107) | <0.001 | 0.878 (0.131) | <0.001 |
| R2 | 0.444 | 0.575 | ||