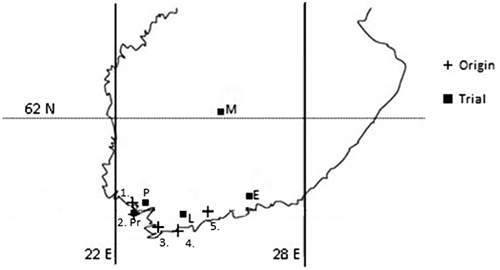
Fig. 1. Locations of natural stands (crosses) and trial sites (filled squares). Seedlings were taken from stands: 1: Ruissalo (60°26´N, 22°08´E, ETRS89) and Katariinanlaakso (60°25´N, 22°16´E) in Turku, 2: Parainen-Lenholmen (60°14´N, 22°12´E), 3: Tammisaari-Framnäs (60°01´N, 23°06´E), 4: Inkoo-Elisaari (59°58´N, 23°54´E) and 5: Helsinki-Malmi (60°14´N, 25°01´E). Trials were conducted at Elimäki (E), Lohja (L), Muurame (M), Paimio (P) and Parainen (Pr).
| Table 1. Basic descriptive data concerning the pedunculate oak trials. DD = day degrees, OMT = Oxalis acetosella -Vaccinium myrtillus type (Cajander 1949), RBD = randomized block design. | |||||
| Parameters | Trial location | ||||
| Elimäki | Lohja | Muurame | Paimio | Parainen | |
| Planting date | 25/05/1998 | 29/05/1998 | 02/06/1998 | 28/05/1998 | 12/06/1998 |
| Longitude (E) | 26°23´ | 24°08´ | 25°32´ | 22°45´ | 22°25´ |
| Latitude (N) | 60°43´ | 60°14´ | 62°11´ | 60°27´ | 60°17´ |
| DD | 1297 °C | 1315 °C | 1160 °C | 1298 °C | 1339 °C |
| Slope (%) | 0−1 | 0−1 | 7 | 0−5 | 0−2 |
| Orientation | - | - | South West | - | North West |
| Elevation (m) (mean sea level) | 45 | 40 | 160 | 32 | 13 |
| Soil type | Arable | Arable | OMT | Arable | Arable |
| Plantation density (trees/ha) | 500 | 500 | 500 | 500 | 500 |
| Preparations | herbicide treatment, ploughing, harrowing | ploughing | mounding | ploughing, harrowing | herbicide treatment, ploughing |
| Plantation design | RBD | RBD | RBD | RBD | RBD |
| Number of blocks | 25 | 25 | 25 | 25 | 25 |
| Spacing (m) | 4.5 × 4.5 | 4.5 × 4.5 | 4.5 × 4.5 | 4.5 × 4.5 | 4.5 × 4.5 |
| Total planting area (ha) | 5.06 | 5 | 4.5 | 5 | 5.1 |
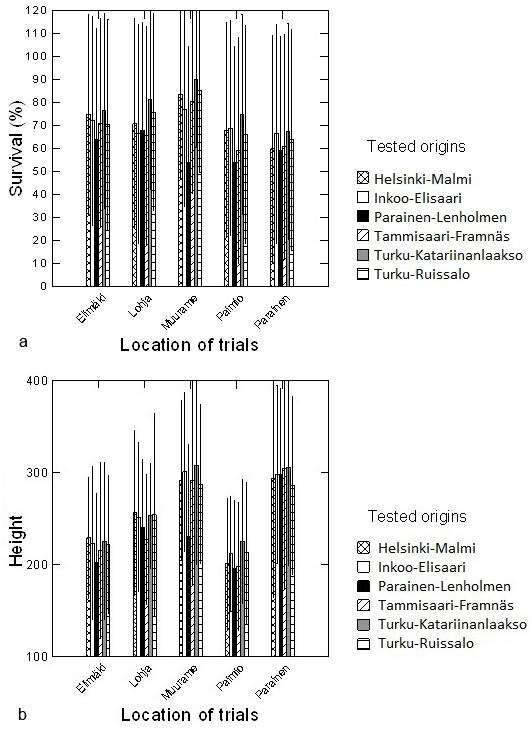
Fig. 2. Mean percent survival (2a) and height (2b) (cm) with standard deviations of pedunculate oak seedlings with different origins after 13 years of growth in several trial sites.
| Table 2. Analysis of variance. Effects of seedling origin, family and trial site on the survival and height of six pedunculate oak populations. | |||||
| Factors | Sources of variation | d.f. | M.S. | F | P |
| Survival | Trial | 4 | 49 684.2 | 27.5 | 0.000 |
| Origin | 5 | 38 354.8 | 21.2 | 0.000 | |
| Trial × origin | 20 | 4167.8 | 2.3 | 0.001 | |
| Block(trial) | 120 | 7590.0 | 4.2 | 0.000 | |
| Family(origin) | 63 | 8438.3 | 4.7 | 0.000 | |
| Family(origin) × trial | 252 | 3432.1 | 1.9 | 0.000 | |
| Error | 8586 | 1807.9 | |||
| Height | Trial | 4 | 1 181 149.9 | 166.4 | 0.000 |
| Origin | 5 | 65 671.0 | 9.2 | 0.000 | |
| Trial × origin | 20 | 18 077.9 | 2.5 | 0.000 | |
| Block(trial) | 120 | 79 080.5 | 11.1 | 0.000 | |
| Family(origin) | 63 | 21 919.7 | 3.1 | 0.000 | |
| Family(origin) × trial | 252 | 7717.7 | 1.1 | 0.169 | |
| Error | 5987 | 7100.3 | |||
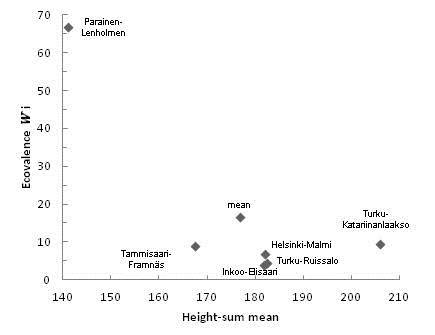
Fig. 3. Ecovalences and mean height-sums of the six seedling origins. Ecovalence values are shown as the proportion contributed by each origin to the total sum of squares.
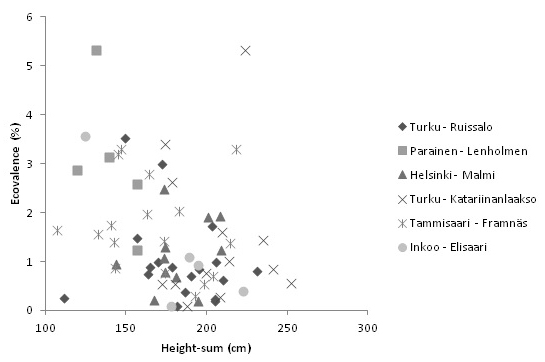
Fig. 4. Open-pollinated family level ecovalences and height-sums for the six seedling origins. Each symbol represents one family in the experiment.