| Table 1. Fertilizer treatments and amounts of nutrients (kg ha-1) added in different treatments in the study area. |
| Nutrient |
| Treatment 1) | N | P | K | Ca | Mg | B |
| Cont | 0 | 0 | 0 | 0 | 0 | 0 |
| PK | 0 | 54 | 102 | 156 | 3 | 1.8 |
| PK+N | 110 | 54 | 102 | 172 | 6 | 1.8 |
| ApaBio | 0 | 79 | 102 | 270 | 123 | 0 |
| ApaBio+N | 110 | 79 | 102 | 286 | 126 | 0 |
| Ash | 0 | 135 | 225 | 1440 | 225 | 1.8 |
| Ash+N | 110 | 135 | 225 | 1456 | 228 | 1.8 |
| Table 2. Mean foliar nutrient concentrations before and 9, 14 and 26 years after the fertilization treatments. Statistically different means are marked with different letters (Bonferroni test, p-value < 0.05). See Table 1 for the information of treatments. Means below critical levels (deficiency limit) for N (12 g kg–1), P (1.3 g kg–1), K (4.0 g kg–1) (see Paarlahti et al., 1971, Reinikainen et al., 1998) are marked with bold letters. |
| | Years after fertilization |
| 0 | 9 | 14 | 26 |
| Nutrient | Treatment | Mean | S.E. | Mean | S.E. | Mean | S.E. | Mean | S.E. |
| N, g kg–1 | Cont | 13.2 | 0.7 | 13.6 | 0.7 | 14.5 | 0.4 | 15.2 | 0.5 |
| PK | 13.1 | 0.7 | 14.1 | 0.5 | 13.9 | 0.2 | 15.5 | 0.4 |
| ApaBio | 12.8 | 0.2 | 13.5 | 0.3 | 14.0 | 0.3 | 15.9 | 0.6 |
| Ash | 12.5 | 0.7 | 14.0 | 0.2 | 14.4 | 0.4 | 15.3 | 0.5 |
| P, g kg–1 | Cont | 1.18 | 0.04 | 1.23a | 0.04 | 1.36a | 0.08 | 1.24a | 0.05 |
| PK | 1.14 | 0.04 | 1.64b | 0.04 | 1.59b | 0.04 | 1.41ab | 0.02 |
| ApaBio | 1.24 | 0.07 | 1.55b | 0.03 | 1.58b | 0.04 | 1.47b | 0.06 |
| Ash | 1.12 | 0.05 | 1.57b | 0.03 | 1.61b | 0.01 | 1.36ab | 0.05 |
| K, g kg–1 | Cont | 3.19 | 0.11 | 3.01a | 0.06 | 3.10a | 0.06 | 3.00a | 0.08 |
| PK | 3.26 | 0.01 | 4.34b | 0.23 | 3.99b | 0.14 | 3.70b | 0.10 |
| ApaBio | 3.11 | 0.05 | 3.86b | 0.17 | 3.77b | 0.16 | 3.56ab | 0.17 |
| Ash | 2.96 | 0.21 | 4.23b | 0.12 | 4.26b | 0,17 | 4.05b | 0.14 |
| Ca, g kg–1 | Cont | 2.01 | 0.12 | 2.03 | 0.16 | 1.68 | 0.10 | 2.21 | 0.12 |
| PK | 1.96 | 0.09 | 2.11 | 0.16 | 1.73 | 0.08 | 1.94 | 0.11 |
| ApaBio | 1.97 | 0.21 | 2.06 | 0.11 | 1.63 | 0.10 | 1.99 | 0.10 |
| Ash | 2.03 | 0.16 | 2.08 | 0.08 | 1.74 | 0.07 | 2.15 | 0.13 |
| Mg, g kg–1 | Cont | 1.37 | 0.05 | 1.31a | 0.04 | 1.42 | 0.04 | 1.29 | 0.03 |
| PK | 1.36 | 0.03 | 1.01b | 0.04 | 1.36 | 0.04 | 1.24 | 0.06 |
| ApaBio | 1.37 | 0.07 | 1.17a | 0.04 | 1.35 | 0.05 | 1.23 | 0.05 |
| Ash | 1.32 | 0.07 | 1.01b | 0.03 | 1.25 | 0.04 | 1.16 | 0.04 |
| B, mg kg–1 | Cont | 45 | 4.1 | 26 | 0.8 | 21 | 1.1 | 22 | 1.0 |
| PK | 42 | 5.1 | 27 | 0.9 | 23 | 1.0 | 23 | 1.0 |
| ApaBio | 46 | 9.2 | 23 | 0.8 | 20 | 07 | 22 | 0.9 |
| Ash | 41 | 3.3 | 27 | 0.8 | 24 | 1.1 | 24 | 1.3 |
| Table 3. The ratios of N:P and N:K in Scots pine needles by treatments during the study period of 26 years. See Table 1 for the information of treatments. Optimal values for N:P = 10–11, and for N:K = 3–4 (e.g. Puustjärvi 1962a,b; Ingestad 1979). Statistically different means between treatments are marked with different letters (Bonferroni test, p-value < 0.05). |
| N:P ratio |
| | Years from fertilization |
| Treatment | 0 | 9 | 14 | 26 |
| Cont | 11.4 | 11.2 a | 10.9 a | 12.5 |
| PK | 11.6 | 8.7 b | 8.8 b | 11.0 |
| ApaBio | 10.3 | 8.7 b | 8.9 b | 10.9 |
| Ash | 10.8 | 8.9 b | 9.0 b | 11.4 |
| N:K ratio |
| | Years from fertilization |
| 0 | 9 | 14 | 26 |
| Cont | 4.1 | 4.5 a | 4.7 a | 5.1 a |
| PK | 4.0 | 3.3 b | 3.5 b | 4.2 ab |
| ApaBio | 4.1 | 3.5 b | 3.8 b | 4.5 ab |
| Ash | 4.3 | 3.3 b | 3.4 b | 3.8 b |
| Table 4. Results of Greenhouse-Geisser tests in repeated measures ANOVA. Df-values, F values, and adjusted p-values for the time factor and the interaction of fertilization treatment and time. The response variables are the foliar N, P and K concentations and periodic (5 year) stand growth. |
| Variable | Effect | df | F | p |
| N | Time | 1.61 | 100.2 | <0.001 |
| Time* treatment | 9.63 | 1.28 | 0.267 |
| P | Time | 1.70 | 169.5 | <0.001 |
| Time* treatment | 10.2 | 2.15 | 0.033 |
| K | Time | 1.90 | 91.8 | <0.001 |
| Time* treatment | 11.39 | 5.93 | <0.001 |
Stand
growth | Time | 2.10 | 60.37 | <0.001 |
| Time* treatment | 12.58 | 4.80 | <0.001 |
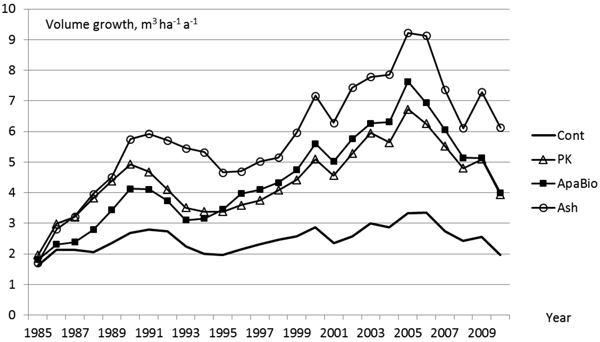
Fig. 1. The development of annual volume growth of Scots pine in 1985–2010 by covariance analysis (pre-treatment volume growth as covariate). See Table 1 for the information of treatments. The comparison between fertilizers including P and K. Statistically significant differences in the total stand growth during the study period (p < 0.05 in Bonferroni test): Control vs. PK; Control vs. ApaBio; Control vs. Ash; PK vs. Ash; ApaBio vs. Ash.
| Table 5. The stand characteristics before and after cutting in 2010 and logging removals by treatments. See Table 1 for the information of treatments. Covariate adjusted values (pre-treatment volume as covariate); statistically different means are marked with different letters. |
| Treatment | Growing stock before cutting, m3 ha-1 | Removal in cutting, m3 ha-1 |
| | Volume | Saw logs | | Total | Saw logs | Pulp wood |
| Cont | 93 a | 8 | 43 a | 1 | 39 |
| PK | 148 b | 42 | 66 ac | 9 | 54 |
| PK+N | 143 bd | 36 | 68 cbe | 10 | 54 |
| ApaBio | 151 bd | 26 | 77 cbe | 5 | 66 |
| ApaBio+N | 143 b | 31 | 67 ac | 8 | 55 |
| Ash | 182 c | 60 | 93 de | 15 | 73 |
| Ash+N | 177 cd | 56 | 83 cbe | 15 | 63 |
| Growing stock after cutting, m3 ha-1 |
| | Total | Saw logs | Pulp wood | |
| Cont | | 48 a | 8 | 38 |
| PK | 79 bc | 35 | 43 |
| PK+N | 72 b | 26 | 45 |
| ApaBio | 72 b | 22 | 48 |
| ApaBio+N | 73 b | 25 | 47 |
| Ash | 90 cd | 45 | 44 |
| Ash+N | 93 cd | 42 | 49 |
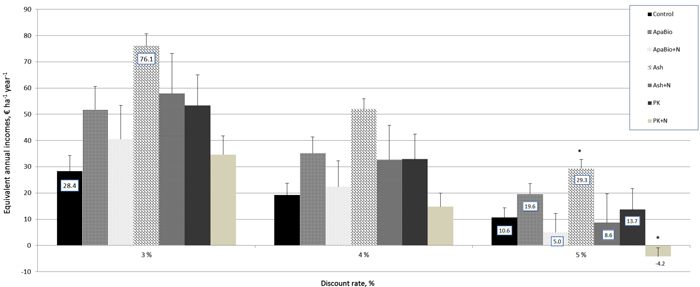
Fig. 2. Equivalent annual incomes, EAIs associated with alternative treatments, € ha–1 year–1. Discount rate 3%, 4% and 5%. Bars represent averages and line segments illustrate standard deviations divided by two (i.e. positive tops). With 5% discount rate asterisks indicate statistically significant differences (p < 0.05) compared to Control. See Table 1 for the information of treatments. View larger in new window/tab.