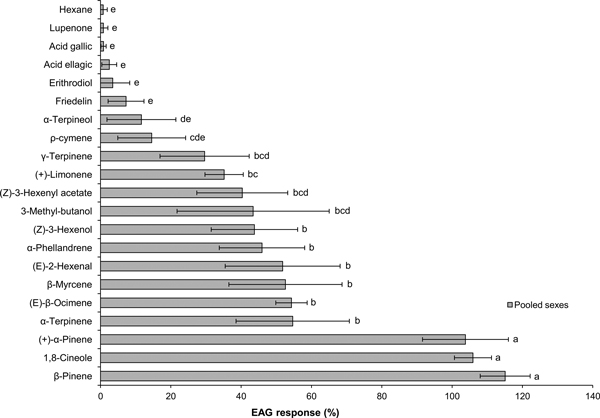
Fig. 1. Mean0.2 (± Error0.2) EAG responses of Prinobius myardi to tree volatiles. Responses are expressed as normalized percentages relative to the standard reference (turpentine oil), after subtracting the response to the hexane control. The hexane control response is included for comparison. Bars with the same letter are not significantly different (heteroscedastic ANOVA for related samples, N = 7).
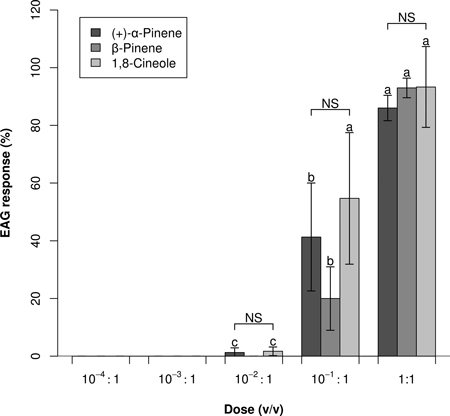
Fig. 2. Dose–response EAG profiles (Mean0.2 ± Error0.2) of Prinobius myardi. Responses are expressed as normalized percentages relative to the standard reference turpentine oil (not shown). For each compound, letters on the columns denote differences between doses; NS indicates no significant difference between compounds at each dose (heteroscedastic ANOVA for related samples, N = 5).