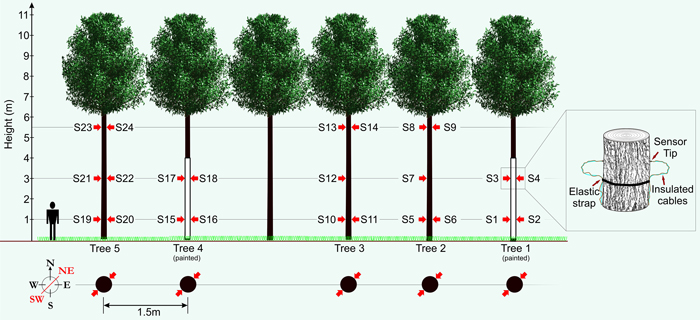
Fig. 1. Schematic showing experimental set-up with sensor (S1–S24) layout (red arrows). View larger in new window/tab.
| Table 1. Independent predictor variables used to model bark surface temperature. | |||
| Independent Variable | Unit | Data Source | |
| Max temperature (Tmax) | Maximum daily temperature | °C | In situ measurements |
| Min temperature (Tmin) | Minimum daily temperature | °C | In situ measurements |
| Mean air temperature (Tmean) | Mean daily temperature | °C | In situ measurements |
| Sunshine (Sun) | Daily sum of sunshine hours | hr | DWD 2015 |
| Cloud cover (Cloud) | Mean daily cloud cover | Okta | DWD 2015 |
| Wind speed (Wind) | Mean daily wind speed | m sec–1 | DWD 2015 |
| Relative humidity (RH) | Mean daily relative humidity | % | DWD 2015 |
| Solar elevation (Elev) | Maximum daily solar elevation | Degrees from horizontal | NOAA 2015 |
| Height | Height on tree bole | m | In-situ measurements |
| Table 2. Model parameters: maximum and minimum daily bark surface temperature as a function of max. temperature (Tmax), min. temperature (Tmin), mean air temperature (Tmean), sunshine duration (Sun), cloud cover (Cloud), wind speed (Wind), relative humidity (RH), solar elevation (Elev) and Height. | ||||||||
| Model | Included Variables | F | df | R | r2adj | p | AIC | |
| Maximum | 1.1 | Tmax | 23052.0 | 1,4979 | 0.907 | 0.822 | <0.001 | 15543.9 |
| 1.2 | Tmax, Sun | 22205.0 | 2,4978 | 0.948 | 0.899 | <0.001 | 12723.7 | |
| 1.3 | Tmax, Sun, Height | 15746.7 | 3,4977 | 0.951 | 0.905 | <0.001 | 12447.3 | |
| 1.4 | Tmax, Sun, Height, Wind | 12162.4 | 4,4976 | 0.952 | 0.907 | <0.001 | 12315.7 | |
| 1.5 | Tmax, Sun, Height, Wind, Elev | 9944.2 | 5,4975 | 0.953 | 0.909 | <0.001 | 12218.3 | |
| 1.6 | Tmax, Sun, Height, Wind, Elev, RH | 8296.5 | 6,4974 | 0.953 | 0.909 | <0.001 | 12214.1 | |
| Minimum | 2.1 | Tmin | 113926.5 | 1,4979 | 0.979 | 0.958 | <0.001 | 2151.5 |
| 2.2 | Tmin, Cloud | 59781.8 | 2,4978 | 0.980 | 0.960 | <0.001 | 1921.8 | |
| 2.3 | Tmin, Cloud, Tmean | 45176.1 | 3,4977 | 0.982 | 0.965 | <0.001 | 1322.0 | |
| 2.4 | Tmin, Cloud, Tmean, RH | 34677.8 | 4,4976 | 0.983 | 0.965 | <0.001 | 1211.5 | |
| 2.5 | Tmin, Cloud, Tmean, RH, Wind | 28256.3 | 5,4975 | 0.983 | 0.966 | <0.001 | 1124.2 | |
| 2.6 | Tmin, Cloud, Tmean, RH, Wind, Elev | 24164.9 | 6,4974 | 0.983 | 0.967 | <0.001 | 1000.5 | |
| 2.7 | Tmin, Cloud, Tmean, RH, Wind, Elev, Height | 20730.5 | 7,4973 | 0.983 | 0.967 | <0.001 | 997.5 | |
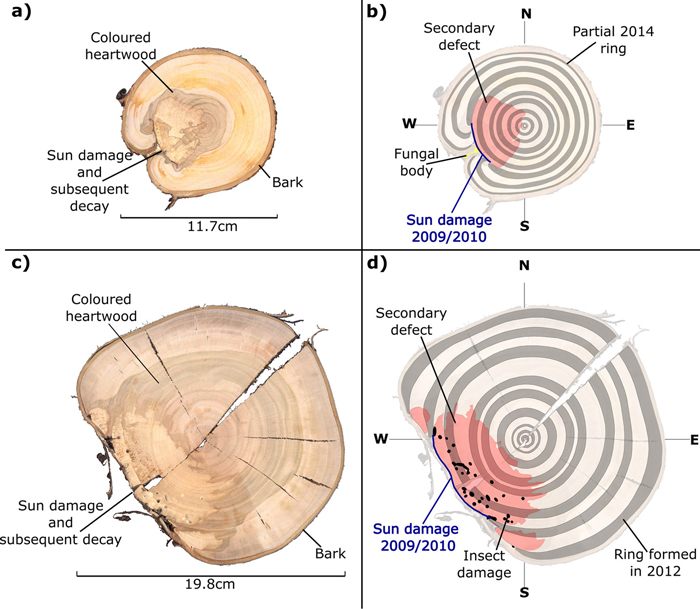
Fig. 2. Stem discs (at 1.3 m above ground level) taken from sun damaged Prunus avium grown within an AFS. True colour images (a and c) and false colour images to highlight tree rings and damaged regions (b and d).
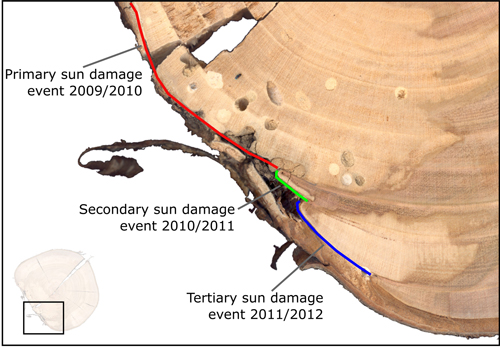
Fig. 3. Enlarged image displaying primary (red) cambium damage with associated decay, also with secondary (green) and tertiary (blue) damages to cambium tissues in subsequent years.
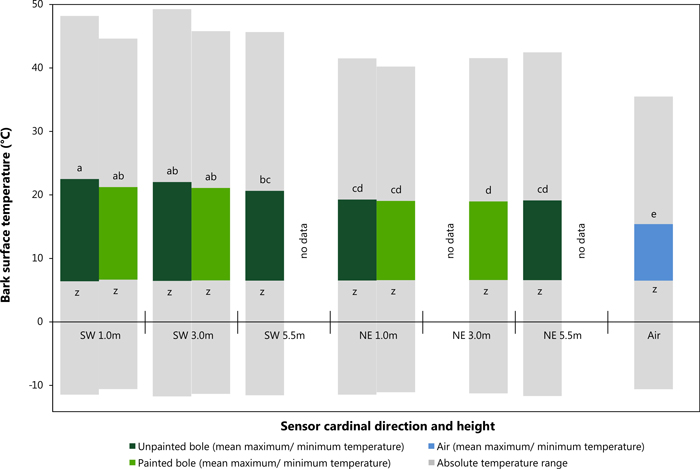
Fig. 4. Average maximum and minimum bark surface temperature values with absolute maximum and minimum temperature records between sensor direction and height (Tukey HSD, significance level p < 0.05, Maximum: p-values: a = 0.159, b = 0.172, c = 0.054, d = 0.999 e = 1.000; Minimum: p-values: z = 0.998). View larger in new window/tab.
| Table 3. Regression parameters Model 1.6: maximum SW bark surface temperature and model 2.7: minimum SW bark surface temperature using max. temperature (Tmax), min. temperature (Tmin), mean air temperature (Tmean), sunshine duration (Sun), cloud cover (Cloud), wind speed (Wind), relative humidity (RH), solar elevation (Elev) and Height as predictor variables. | |||||||
| Dependent Variable | Independent Variables | Unstandardised coefficients | t | p | |||
| β | SE | ||||||
| Max. Daily Bark Surface Temp. | |||||||
| Model 1.6 | Intercept | 5.786 | 0.653 | 8.863 | <0.001 | ||
| Tmax | 0.990 | 0.010 | 94.914 | <0.001 | |||
| Sun | 0.798 | 0.017 | 46.097 | <0.001 | |||
| Height | –0.455 | 0.026 | –17.351 | <0.001 | |||
| Wind | –0.444 | 0.038 | –11.576 | <0.001 | |||
| Elev | 0.041 | 0.004 | 9.325 | <0.001 | |||
| RH | –0.016 | 0.006 | –2.489 | 0.013 | |||
| Min. Daily Bark Surface Temp. | |||||||
| Model 2.7 | Intercept | –6.361 | 0.225 | –28.291 | <0.001 | ||
| Tmin | 0.663 | 0.011 | 59.100 | <0.001 | |||
| Cloud | 0.222 | 0.011 | 19.924 | <0.001 | |||
| Tmean | 0.301 | 0.011 | 26.327 | <0.001 | |||
| RH | 0.037 | 0.002 | 17.039 | <0.001 | |||
| Wind | 0.148 | 0.013 | 11.759 | <0.001 | |||
| Elev | 0.018 | 0.002 | 11.284 | <0.001 | |||
| Height | 0.019 | 0.008 | 2.252 | 0.024 | |||
| Table 4. Summary of extreme temperature measurements. | ||||
| Parameter | Bark Surface Temp. (Air Temp.*) (°C) | Height on tree bole (m) | Sensor(s) Nr. | Date and Time of occurrence |
| Unpainted Trees | ||||
| Max. (SW) | 49.1 (31.1) | 3.0 | 12 | 22.07.13 / 14:25 |
| Max. (NE) | 42.3 (34.8) | 5.5 | 14 | 27.07.13 / 14:30 |
| Min. (SW) | –11.8 (–10.5) | 5.5 | 13 | 29.12.14 / 05:35 |
| Min. (NE) | –11.7 (–10.6) | 3.0 | 22 | 29.12.14 / 05:45 |
| Greatest difference (SW/NE) | 14.7 (10.2) | 1.0 | 5/6 | 02.03.14 / 14:45 |
| Max. range within 24hrs (SW) | 38.0 (17.1) | 1.0 | 5 | 17.04.14 / 24hrs |
| Painted Trees | ||||
| Max. (SW) | 45.6 (31.1) | 3.0 | 3 | 22.07.13 / 14:55 |
| Max. (NE) | 41.4 (34.8) | 3.0 | 4 | 27.07.13 / 14:30 |
| Min. (SW) | –11.4 (–10.5) | 3.0 | 3 | 29.12.14 / 05:35 |
| Min. (NE) | –11.3 (–9.9) | 3.0 | 4 | 29.12.14 / 06:25 |
| Greatest difference (SW/NE) | 10.2 (4.0) | 3.0 | 17/18 | 15.03.13 / 14:50 |
| Max. range within 24hrs (SW) | 33.8 (22.6) | 1.0 | 1 | 15.04.15 / 24hrs |
| Air temperature during study period: mean 10.7 °C, maximum 35.4 °C, minimum: –10.6 °C * Concurrent air temperature measurement | ||||
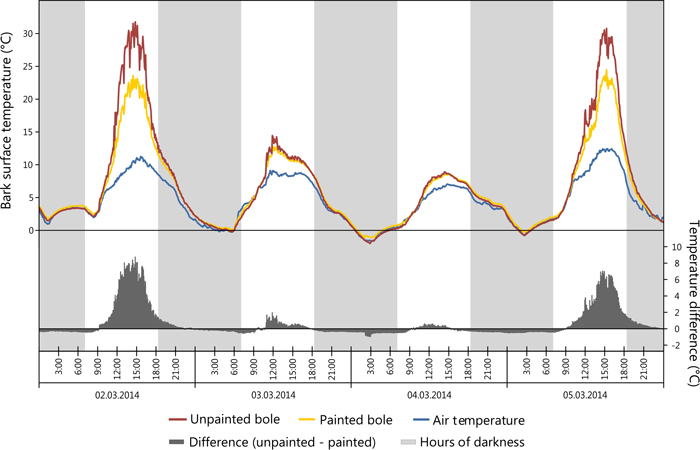
Fig. 5. Comparison of painted (sensor 1) vs. unpainted (sensor 5) tree boles in regards to bark surface temperature. View larger in new window/tab.
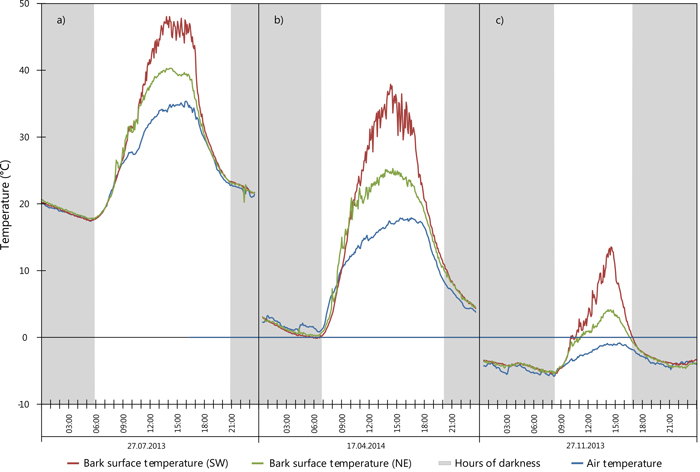
Fig. 6. Extreme values for SW (sensor 5) and NE (sensor 6) surface temperature during selected 24 hour periods: a) maximum recorded temperature; b) maximum range; c) large SW temperature variation including sub-zero temperatures. View larger in new window/tab.
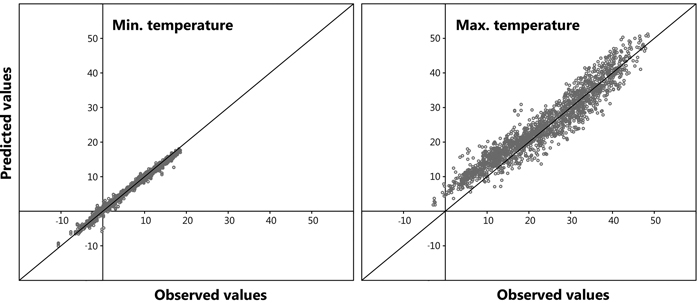
Fig. 7. Model validation: predicted vs. observed values.
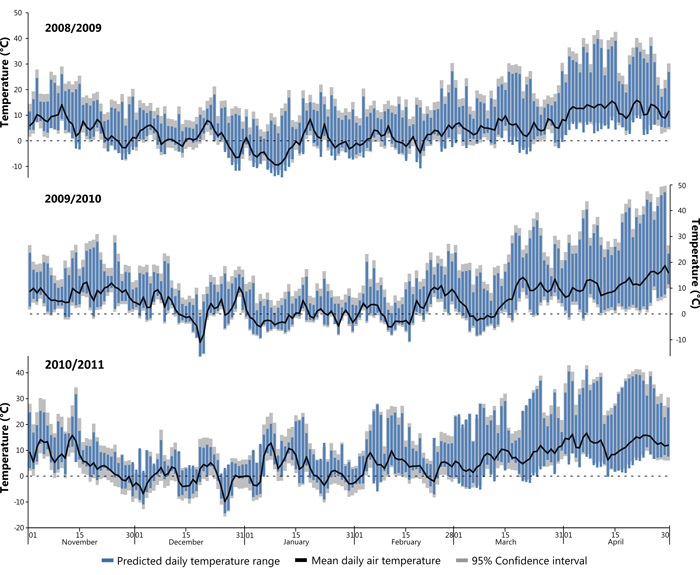
Fig. 8. Modelled daily temperature range for the three successive winters (Nov–Apr) in 2008/09, 2009/10 and 2010/11. View larger in new window/tab.