| Table 1. Characteristics of the Finnish planting machine businesses during the 2013 planting season. | ||||||
| Parameter | Unit a) | N | Average | Min. | Max. | SD |
| Age of owner of the business | yr | 20 | 47.1 | 32 | 63 | 9.1 |
| Foundation of the business | yr | 20 | 29.3 | 3 | 52 | 15.4 |
| Providing mechanized planting services | yr | 22 | 6.2 | 1 | 21 | 6.0 |
| Number of machines owned | pcs | 20 | 9.3 | 3 | 22 | 5.3 |
| Number of excavators owned | pcs | 20 | 3.0 | 0 | 8 | 2.0 |
| Share of annual revenue due to planting | % | 22 | 18.7 | 3 | 90 | 19.1 |
| Number of clients | pcs | 22 | 1.7 | 1 | 3 | 0.8 |
| a) pcs = pieces; yr = year | ||||||
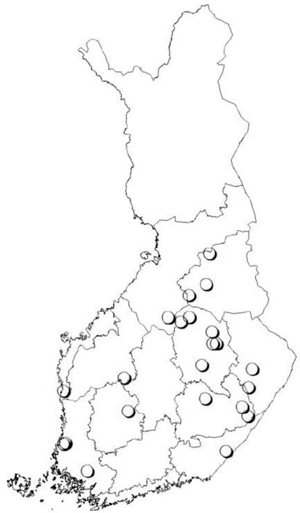
Fig. 1. Distribution of mechanized planting businesses (n=22) in 2013. Copyright Karttakeskus Ltd, L11040/14.
| Table 2. The extent of Finnish mechanized planting operations during the 2013 planting season. | ||||||
| Parameter | Unit a) | N | Average | Min. | Max. | SD |
| Planting season | w | 29 | 19.8 | 13.1 | 24.9 | 3.19 |
| Stoppage | w | 29 | 1.2 | 0 | 8 | 1.97 |
| Other work during planting season | w | 29 | 0.8 | 0 | 8 | 1.93 |
| Planting season excluding stoppages | w | 29 | 18.6 | 11.1 | 24.8 | 3.60 |
| Other work outside the planting season | m | 29 | 2.9 | 0 | 8 | 1.92 |
| Planted area | ha | 31 | 85.9 | 25.0 | 177.0 | 39.9 |
| Planted seedlings | pcs | 31 | 151 242 | 45 000 | 320 000 | 69 979.7 |
| a) ha = hectares; m = months; pcs = pieces; w = number of weeks | ||||||
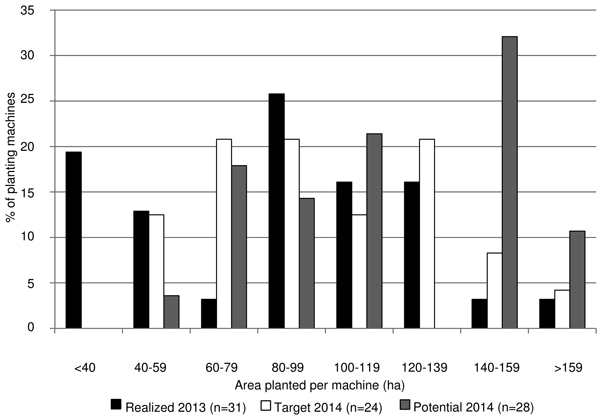
Fig. 2. Number of realized hectares planted by machine in 2013 compared to the target and potential area for 2014. Target is the realistic amount of planting work for 2014 and potential is a theoretical maximum that could be planted. At the time of the interview, some respondents could not evaluate the target for planting work in 2014.
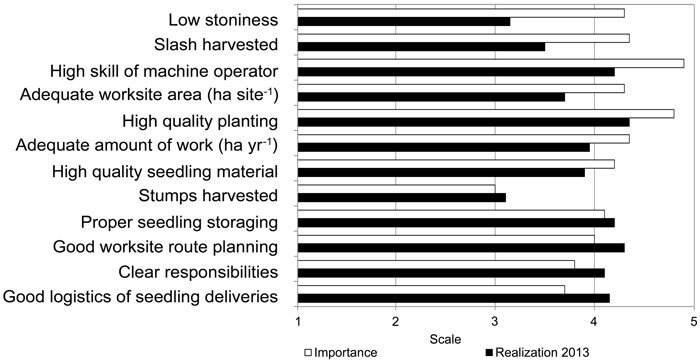
Fig. 3. Impact and importance of 12 factors affecting the productivity and cost-efficiency of mechanized planting as well as how these 12 factors were realized in 2013. Evaluations were made on a five-level Likert scale (importance: 1 = unimportant, 2 = of little importance, 3 = moderately important, 4 = important, 5 = very important, and realization: 1 = very poor, 2 = poor, 3 = fair, 4 = good, 5 = very good).
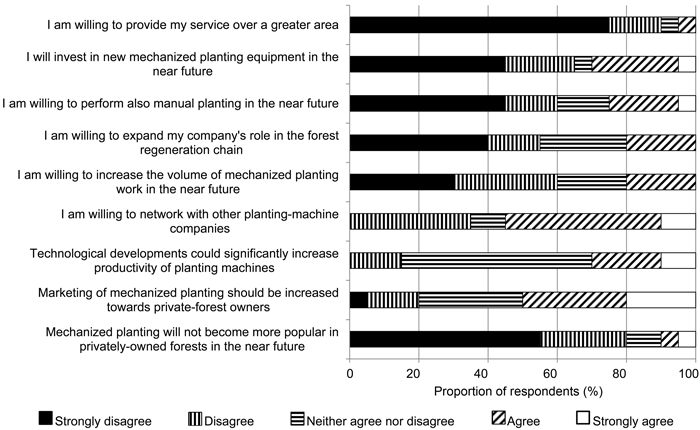
Fig. 4. Response of respondents (n=20) to nine statements concerning the future of mechanized planting in Finland. Responses were made on a five-level Likert scale (importance: 1 = strongly disagree, 2 = disagree, 3 = neither agree nor disagree, 4 = agree, 5 = strongly agree).
| Table 3. Comparison of the Finnish mechanized tree-planting industry in 2003 (Vartiamäki 2003) and 2013. | ||||
| Parameter | Unita) | 2003 | 2013 | Difference to 2003 (%) |
| Number of planting devices | pcs | 16 | 31 | 93.8 |
| Number of businesses | pcs | 14 | 22 | 57.1 |
| Planting machines per business | pcs | 1.14 | 1.41 | 23.7 |
| Number of planting devices | pcs | 16 | 31 | 93.8 |
| Bracke | 10 | 18 | 80.0 | |
| Lännen | 4 | 0 | - | |
| Ecoplanter | 2 | 0 | - | |
| M-Planter | 0 | 11 | - | |
| Risutec | 0 | 2 | - | |
| Amount of work | ha | 1420 | 2663 | 87.5 |
| Planted seedlings | million pcs | 2.5 | 4.7 | 88.0 |
| Relocation distance | km | 25b) | 22.2 | –11.2 |
| Working range | km | 100 | 62 | –38 |
| a) ha = hectares; km = kilometers; pcs = pieces b) 20–30 km in literature | ||||