| Table 1. Morphological characteristics of ophiostomatoid fungi found in conductive tissues of Quercus robur in the Tellerman forest, Russia. Results are based on 30–50 measurements of each taxonomically informative morphological structure. | |||
| Characteristics | O. fusiforme-like | O. grandicarpum | O. quercus |
| Perithecia | |||
| base diameter (µm) | 100–250 | 350–500 | 160–220 |
| neck length (µm) | 350–800 | 2000–8000 | 930–1600 |
| Ostiolar hyphae | present | absent | present |
| Ascospores | |||
| shape | allantoid, no sheath | orange section, possibly with sheath | allantoid, no sheath |
| size (µm) | (4.5–5.0) × (1.0–1.5) | (4.0–5.0) × (1.5–2.0) | (3.9–5.2) × (1.3–2.0) |
| Anamorph | sporothrix-like | sporothrix-like | sporothrix- and pesotum-like |
| Growth rate on malt extract agar (mm day–1) | 1.3 ± 0.2 | 1.3 ± 0.2 | 4.0 ± 0.4 |
| Colony morphology | snow-white, fluffy, ascending | light-grey, no aerial mycelia | initially white, darkening with age |
| Substrate | phloem аnd sapwood | phloem | phloem аnd sapwood |
| Culture collection no. | CMW41130 | CMW41131 | CMW41129 |
| GenBank acc. no | |||
| ITS | KP289352 | KP289353 | KP289351 |
| β-tubulin | KP289355 | KP289356 | KP289354 |
| Table 2. Number of ophiostomatoid fungi in collected Quercus robur samples in Tellerman forest. In total of 286 wood samples were investigated during 2005–2009. More than one ophiostomatoid species were possible to find in the same wood sample. | ||
| Fungal species | No. of wood samples with fungi | Percentage of fungi (%) |
| In total | ||
| Ophiostoma grandicarpum | 15 | 5.2 |
| O. fusiforme-like | 61 | 21.3 |
| O. quercus | 93 | 32.5 |
| Species present in the same sample | ||
| O. grandicarpum alone | 12 | 4.2 |
| O. fusiforme-like alone | 31 | 10.8 |
| O. quercus alone | 65 | 22.7 |
| O. grandicarpum + O. fusiforme-like | 2 | 0.7 |
| O. grandicarpum + O. quercus | 0 | 0 |
| O. fusiforme + O. quercus | 27 | 9.4 |
| O. grandicarpum + O. fusiforme-like + O. quercus | 1 | 0.4 |
| Total | 138 | 48.2 |
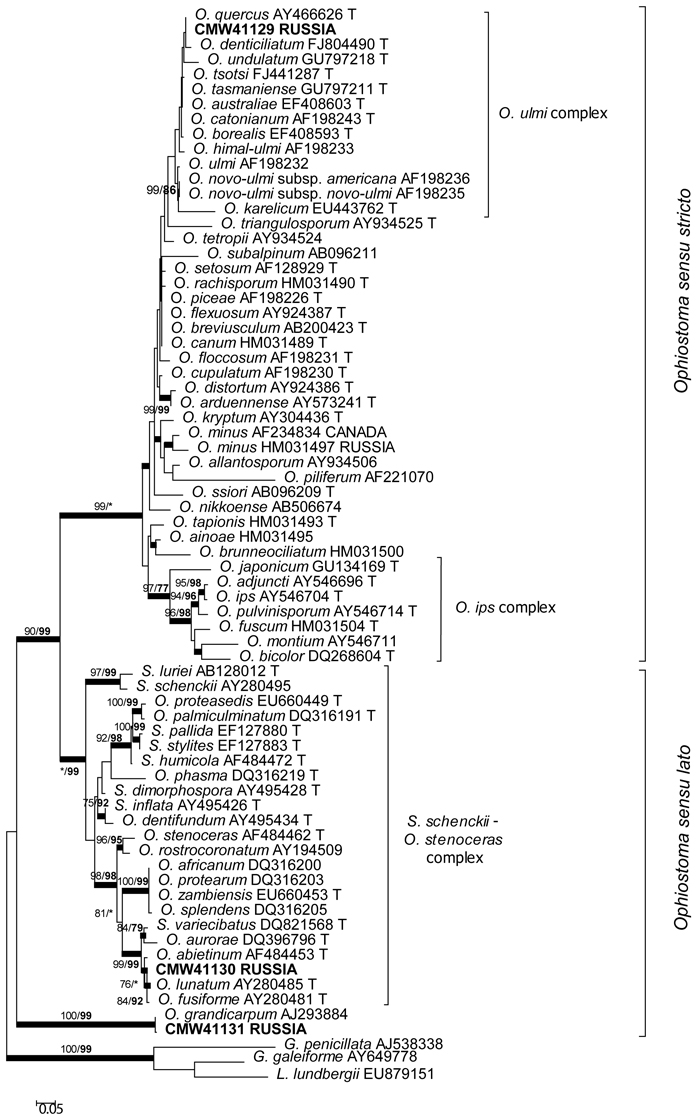
Fig. 1. Phylogram obtained from ML analyses of the ITS regions. Isolate numbers of sequences obtained in this study are printed in bold type. The bootstrap support values for ML (normal type) and MP (bold type) above 70% are indicated at the nodes. Posterior probabilities (above 90%) obtained from BI are indicated by bold lines at the relevant branching points. * = bootstrap values lower than 70%. T = ex-type isolates. Scale bar = total nucleotide difference between taxa.
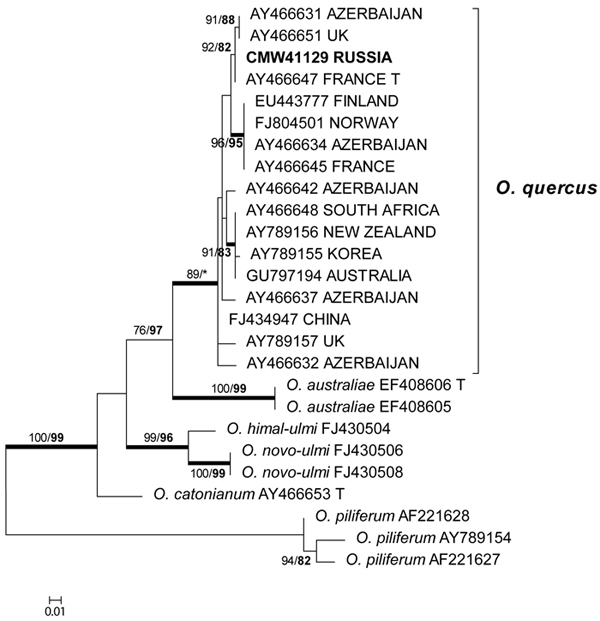
Fig. 2. Phylogram obtained from ML analyses of the β-tubulin gene of species in the O. ulmi complex. Isolate numbers of sequences obtained in this study are printed in bold type. The bootstrap support values for ML (normal type) and MP (bold type) above 70% are indicated at the nodes. Posterior probabilities (above 90%) obtained from BI are indicated by bold lines at the relevant branching points. * = bootstrap values lower than 70%. T = ex-type isolates. Scale bar = total nucleotide difference between taxa.
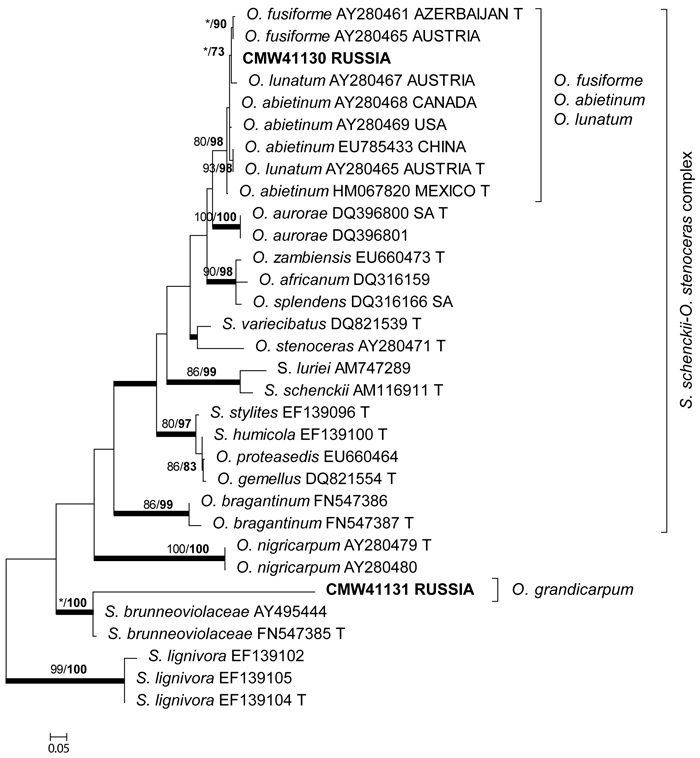
Fig. 3. Phylogram obtained from ML analyses of the β-tubulin gene of species in the S. schenckii–O. stenoceras complex. Isolate numbers of sequences obtained in this study are printed in bold type. The bootstrap support values for ML (normal type) and MP (bold type) above 70% are indicated at the nodes. Posterior probabilities (above 90%) obtained from BI are indicated by bold lines at the relevant branching points. * = bootstrap values lower than 70%. T = ex-type isolates. Scale bar = total nucleotide difference between taxa.
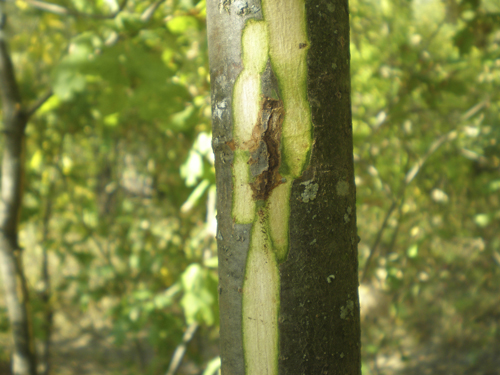
Fig. 4. Brown necrosis caused by Ophiostoma quercus in the inner bark of young Quercus robur tree 10 months after the inoculation. Аgar blocks overgrown with the fungus mycelium served an inoculum. Necrosis size: length 47 mm; width 10 mm.
| Table 3. Lesion sizes (x ± m, mm) in the phloem at the end of the inoculation experiment of young Quercus robur trees (size of the wound area is deducted from necrosis area). | |||
| Inoculation variant used in August 2010 | Measured in September 2010 | Measured in May 2011 | |
| Lenght | Lenght | Width | |
| Ophiostoma grandicarpum | 1.7 ± 1.7 | 16.7 ± 8.8 | 0 |
| O. fusiforme-like | 10.3 ± 7.5 | 30.6 ± 8.5 | 4.1 ± 4.1 |
| O. quercus | 5.1 ± 2.3 | 69.1 ± 20.5* | 11.1 ± 3.9 |
| Sterile agar block | 5.7 ± 4.7 | 9.0 ± 3.8 | 0 |
| Control (wounding without inoculation) | 0 | 3.3 ± 3.3 | 3.3 ± 3.3 |
| *Significantly different from control (wounding without inoculation) according to Mann-Whitney test (P ≤ 0.05). | |||