| Table 1. Description of the data used for testing the fertilization functions. Basal area, volume, age and current annual increment (CAI) refer to values at time of fertilizer application. AN is ammonium nitrate. Observed response (m3 ha–1 5 yr–1) is over bark. View in new window/tab. |
| Table 2. Means and standard deviations (SD) of observed 5-year response, and means and SD of differences between the predictive Pettersson (1994) and Rosvall (1980) functions’ responses and observed responses for all plots and subset of plots. “Difference” in bold indicates significant difference between mean 5-year predicted and observed response (p < 0.05). r = correlation coefficient. Means and SD in m3 ha–1 5 yrs–1 above bark. AN is ammonium nitrate. | |||||||||
| 5 year observed response | Pettersson | Rosvall | |||||||
| Dataset | N | Mean | SD | Difference | SD | r | Difference | SD | r |
| All plots | 721 | 5.12 | 4.63 | 0.75 | 4.57 | 0.40 | 0.13 | 4.64 | 0.34 |
| Spruce | 301 | 4.24 | 4.53 | 1.64 | 5.04 | 0.19 | 1.36 | 5.2 | 0.16 |
| Pine | 420 | 5.76 | 4.61 | 0.11 | 4.09 | 0.53 | -0.80 | 3.97 | 0.52 |
| AN | 521 | 5.4 | 4.64 | 0.67 | 4.56 | 0.42 | 0.03 | 4.63 | 0.37 |
| Urea | 200 | 4.42 | 4.57 | 0.95 | 4.62 | 0.30 | 0.39 | 4.66 | 0.23 |
| Spruce AN | 214 | 4.66 | 4.56 | 1.28 | 5.02 | 0.23 | 1.02 | 5.26 | 0.19 |
| Spruce Urea | 87 | 3.2 | 4.31 | 2.52 | 5.00 | 0.07 | 2.22 | 4.98 | 0.06 |
| Pine AN | 307 | 5.91 | 4.62 | 0.25 | 4.16 | 0.54 | -0.70 | 4.01 | 0.53 |
| Pine Urea | 113 | 5.35 | 4.56 | -0.26 | 3.91 | 0.53 | -1.01 | 3.87 | 0.53 |
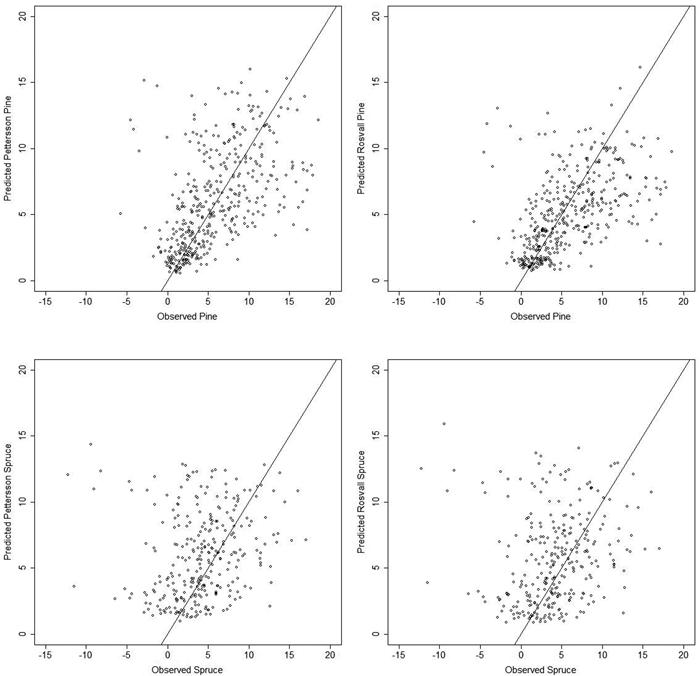
Fig. 1. Scatterplot for 5-year predicted response versus 5-year observed response to N fertilization, all numbers in m3 ha–1 5 yrs–1 above bark. Predicted functions from Pettersson (1994) (Left) and Rosvall (1980) (Right), observed Pine responses top and observed Spruce responses bottom. View larger in new window/tab.
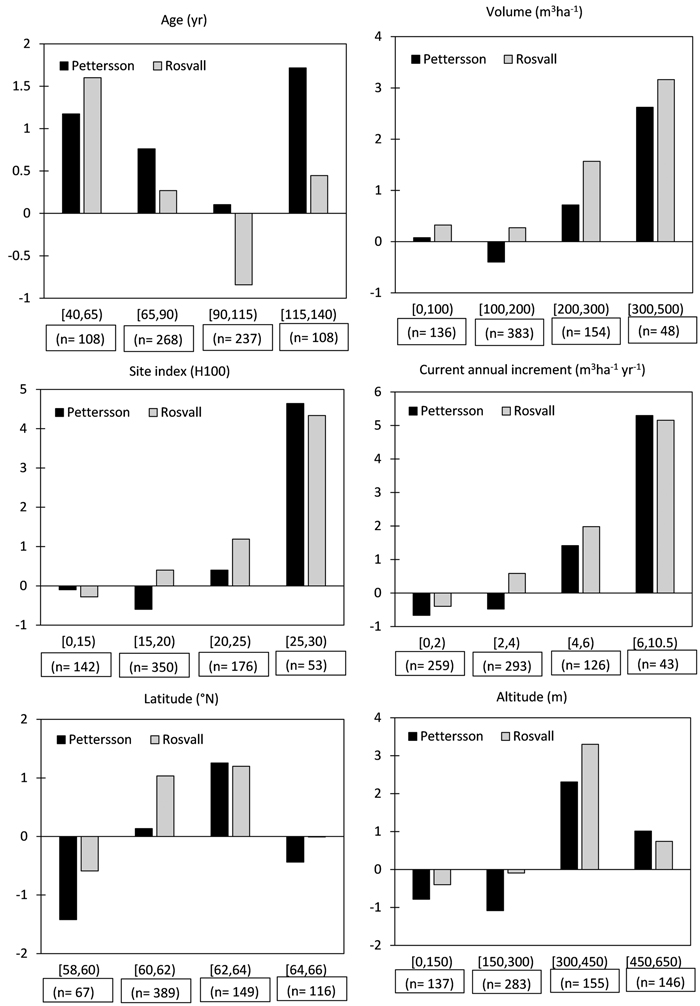
Fig. 2. Mean differences between predicted response to fertilization by the Pettersson and Rosvall functions and observed values, within levels of variables. All y axes are in m3 ha–1 5 yrs–1 above bark.