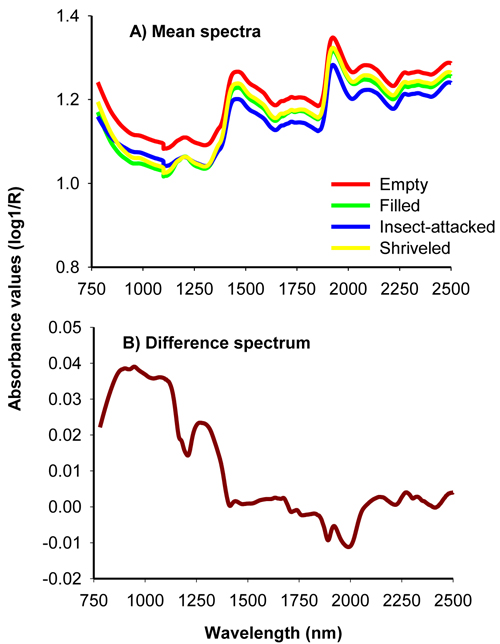
Fig. 1. Average uncorrected NIR spectra of filled-viable, empty, insect-attacked and shriveled seeds of J. polycarpos (A) and difference spectrum of non-viable and viable seeds (B).
| Table 1. A statistical summary of four-class models developed using the full (780–2500 nm) shorter (780–1100 nm) and longer (1100–2500 nm) NIR regions for simultaneously classifying empty, insect-attacked, shriveled and filled-viable seeds of J. polycarpos. | ||||||
| A) PLS-DA | ||||||
| Spectra (nm) | A | R2X | R2Y | Q2 cv | Predtest (%) | |
| 780–2500 | 12 | 0.999 | 0.722 | 0.658 | 66 | |
| 780–1100 | 10 | 0.999 | 0.699 | 0.669 | 71 | |
| 1100–2500 | 14 | 0.999 | 0.750 | 0.686 | 70 | |
| B) OPLS-DA | ||||||
| Spectra (nm) | A | R2Xp | R2Xo | R2Y | Q2 cv | Predtest (%) |
| 780–2500 | 3 + 8 | 0.274 | 0.726 | 0.695 | 0.664 | 69 |
| 780–1100 | 3 + 6 | 0.289 | 0.711 | 0.698 | 0.667 | 71 |
| 1100–2500 | 3 + 8 | 0.275 | 0.725 | 0.671 | 0.638 | 64 |
| A = number of significant components to build the model (for OPLS-DA models , the first value is for predictive component and the second value is for the orthogonal component), R2X = the explained spectral variation (1 – SS(E)/SS(X)), R2Y = the variation between seed classes explained by the model (1 – SS(F)/SS(Y)), R2Xp = the predictive spectral variation; R2Xo = Y-orthogonal variation (spectral variation uncorrelated to class discrimination), Q2cv = the predictive power (the predicted variation) of a model according to cross validation, and Predtest = the overall prediction accuracy of the models for the test set. | ||||||
| Table 2. A matrix of predicted class membership of seed lot fractions in the test set (n = 40 for each seed lot fraction) by four-class PLS-DA and OPLS-DA (values in parenthesis) models developed using different NIR spectral regions. View in new window/tab. |
| Table 3. A statistical summary of two-class models developed using the entire (780–2500 nm) shorter (780–1100 nm) and longer (1100–2500 nm) NIR regions for discriminating viable and non-viable seed of J. polycarpos. | ||||||
| A) PLS-DA | ||||||
| Spectra (nm) | A | R2X | R2Y | Q2 cv | Predtest (%) | |
| 780–2500 | 11 | 0.999 | 0.913 | 0.871 | 99 | |
| 780–1100 | 6 | 0.999 | 0.927 | 0.915 | 99 | |
| 1100–2500 | 7 | 0.999 | 0.914 | 0.888 | 99 | |
| B) OPLS-DA | ||||||
| Spectra (nm) | A | R2Xp | R2Xo | R2Y | Q2 cv | Predtest (%) |
| 780–2500 | 1 + 10 | 0.0312 | 0.969 | 0.916 | 0.905 | 99 |
| 780–1100 | 1 + 9 | 0.0683 | 0.932 | 0.927 | 0.920 | 99 |
| 1100–2500 | 1 + 8 | 0.0121 | 0.988 | 0.892 | 0.878 | 99 |
| A = number of significant components to build the model (for OPLS-DA models , the first value is for predictive component and the second value is for the orthogonal component), R2X = the explained spectral variation, R2Y = between-class variation explained by the model, R2Xp = the predictive spectral variation; R2Xo = spectral variation uncorrelated to class discrimination, Q2cv = the predictive power of a model according to cross validation, and Predtest = the overall prediction accuracy of the models for the test set. | ||||||
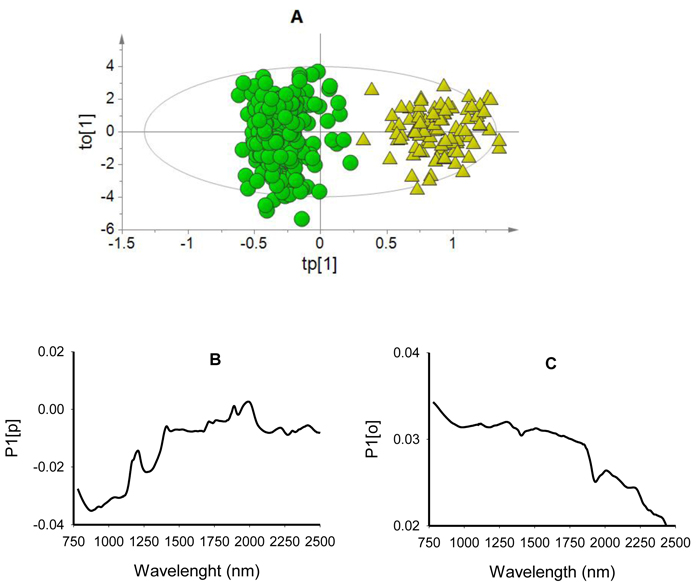
Fig. 2. Score plot for the first predictive (tp[1]) versus orthogonal (to[1]) components showing clear clusters of non-viable (green dots) and viable (yellow triangles) seeds (panel A); loading plot for the first predictive component (P1[p]) showing absorption bands correlating to seed classes (panel B); and loading plot for the first orthogonal component (P1[o]) showing absorption bands that are not correlated to class discrimination (panel C) of OPLS-DA model developed using the entire NIR spectral range (780–2499 nm).
| Table 4. Discrimination of non-viable (empty, insect-attacked and shriveled) and viable seeds in the test set by two-class PLS-DA modelling of different NIR spectral region. | |||||||
| Spectra (nm) | Class | Members | 1 | 2 | No class | 1 & 2 | Correct |
| 780–2500 | Non-viable (1) | 120 | 120 | 0 | 0 | 0 | 100% |
| Viable (2) | 40 | 1 | 39 | 0 | 0 | 97.5% | |
| 780–1100 | Non-viable (1) | 120 | 120 | 0 | 0 | 0 | 100% |
| Viable (2) | 40 | 1 | 39 | 0 | 0 | 97.5% | |
| 1100–2500 | Non-viable (1) | 120 | 120 | 0 | 0 | 0 | 100% |
| Viable (2) | 40 | 1 | 39 | 0 | 0 | 97.5% | |
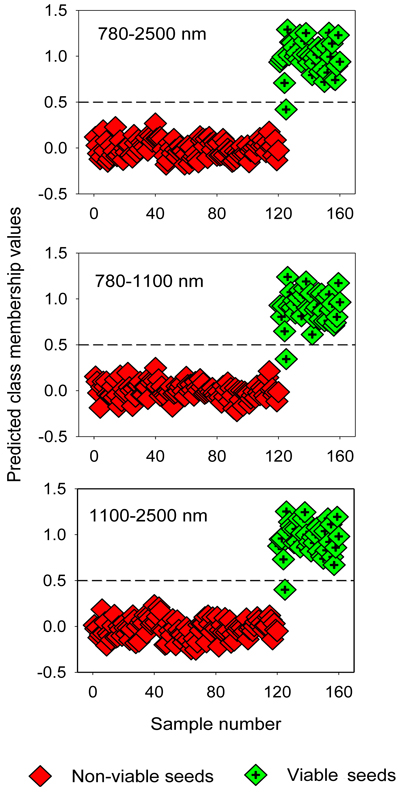
Fig. 3. Discrimination of non-viable (empty, insect-attacked and shriveled) and viable seeds in the test set by two-class OPLS-DA modelling of different NIR spectral regions. The horizontal dotted line is the class limit (Ypredicted > 0.5) for assigning the test sets into viable seed class.
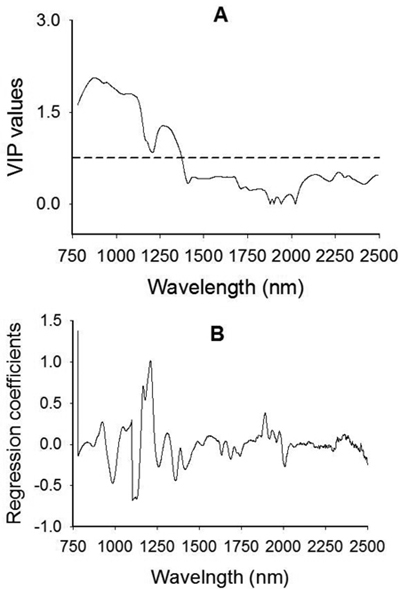
Fig. 4. Plots of Variable Influence on Projection, VIP, (A) and regression coefficients (B) showing spectral regions that influenced the discrimination of viable from non-viable (empty, insect-attacked and shriveled) J. polycarpos seeds. The horizontal dotted line in the VIP plot is the cut-off limit (0.75) for discriminating relevant and irrelevant predictors. The regression coefficient plot is for the viable seeds class.