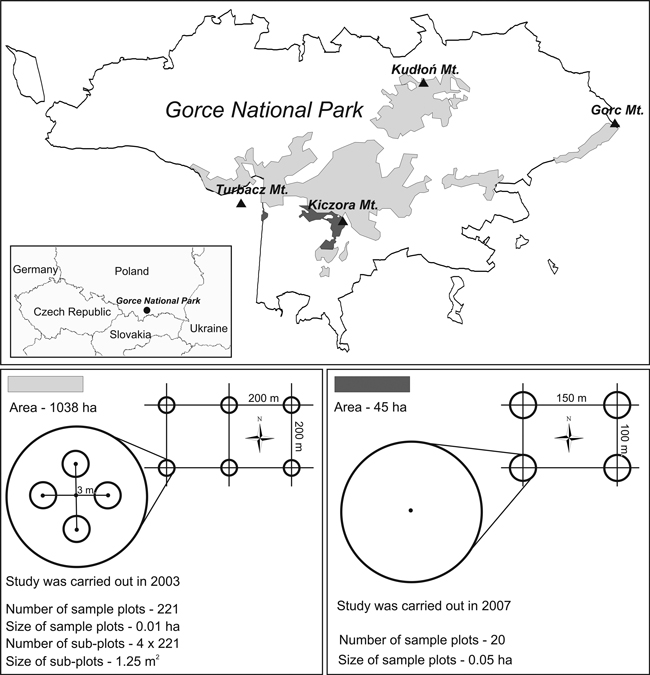
Fig. 1. Location of the study area and the arrangement and characteristics of sample plots.
| Table 1. Measurements taken on sample plots in 2003 and 2007. | |
| Measured characteristic | Rules for measurement and evaluation of characteristics |
| Measurements on an area of 1038 ha in 2003, on 221 sample plots | |
| Picea seedlings (two size classes, current-year seedlings were not included): 1. small: height < 26 cm 2. large: 26 cm ≤ height < 50 cm | Seedling height was measured and two types of microsites were distinguished: 1. forest floor (bare ground, ground with vegetation, litter and also the exposed mineral soil formed by tree fall) and mounds (formed by the root plates of uprooted trees) 2. decaying wood (stumps and fallen deadwood) |
| Picea saplings (eight classes): 1. 0.5 m ≤ height < 1.3 m 2. DBH1 < 1 cm 3. 1 ≤ DBH< 2 cm 4. 2 ≤ DBH< 3 cm 5. 3 ≤ DBH< 4 cm | Sapling height or DBH were measured and four types of microsites were distinguished: 1. forest floor 2. mounds 3. stumps 4. fallen deadwood |
| 6. 4 ≤ DBH< 5 cm 7. 5 ≤ DBH< 6 cm 8. 6 ≤ DBH< 7 cm | For last three classes of saplings, microsite categories were not given because identification was often uncertain. |
| Measurements on an area of 45 ha w 2007, on 20 sample plots | |
| Deadwood type | |
| Standing entire dead trees with DBH ≥ 7 cm | DBH and height of trees |
| Snags – standing snapped trees with stump height ≥ 1.3 m and DBH ≥ 7 cm) | Height and two diameters: under the ground and at the top of snag |
| Stumps with height < 1.3 m and diameter above the ground ≥ 10 cm | Height and two diameters: under the ground and at the top of stump |
| Fallen deadwood: • uprooted trees (windthrown trees with exposed root plates ) • fallen logs, trunks or branch fragments (pieces of a trunk or large branches etc.) Deadwood thinner than 7 cm in diameter was not taken into account. | Fallen deadwood was subdivided into smaller size categories during measurement, each category having a span of 8 cm in diameter: 7–14.9, 15–22.9, 23–30.9, etc. At the end of each deadwood piece, the width and height of the cross-sectional area were measured. The length of the piece and stage of decomposition were recorded on an 8 level scale (Table 2). |
| Regeneration growing on deadwood: | |
| Picea seedlings (two size classes, current-year seedlings were not included): 1. small: height < 26 cm 2. large: 26 cm ≤ height < 50 cm | Height of seedling and the type of microsite it grew on (stump or fallen deadwood). The size category of fallen deadwood and coarse woody debris decomposition were recorded. |
| Saplings on woody microsites were not taken into account because they occurred infrequently and in numbers too low to enable statistical analysis. | |
| Other characteristics measured on sample plots | |
| Living trees – all trees with DBH ≥ 7 cm (all species were included) | DBH and height of trees. |
| Tree losses – all trees that died over 15 years before the 2007 measurement | It was recorded which trees died relative to the 1992 measurement (tree coordinates and DBH were known from 1992). |
| Saplings – all individuals with height ≥ 0.5 m but with DBH < 7 cm (all species were included) | Number of saplings on the sample plot. |
| Slope of sample plot [°] | Slope of the land on which the sample plot was located. |
| Canopy closure [%] | Defined as the percentage of ground area shaded by overhead foliage and estimated visually. |
| 1DBH - diameter at breast height | |
| Table 2. Characteristics of different decay stages of coarse woody debris (Holeksa 1998, modified). | ||||
| Decay stage | Surface | Shape | Depth of penetration of sharpened tool | Branches |
| I | Smooth | Round | Hard, fresh wood | All branches present, elevated above ground |
| II | Smooth | Round | Max. 1 cm or wood bends under the pressure of tool | Branches over 2 cm thick present |
| III | Crevices up to 0.5 cm deep | Round | Up to 2 cm | Branches over 3 cm thick present |
| IV | Crevices about 0.5 cm deep | Round | Up to 4 cm | Only base parts present |
| V | Crevices about 1 cm deep | Round | Up to 6 cm | Only thickest base parts present |
| VI | Several cm thick pieces torn off | Slightly flattened | Wood solid only in the central part of log | Only thickest base parts present |
| VII | Covered with furrows several cm deep | Distinctly flattened | Tool goes through | Lack of any remains |
| VIII | Often covered with vegetation | Flattened, covered with vegetation | Tool goes through | Lack of any remains |
| Table 3. Characteristics of stands and coarse woody debris as measured on twenty 0.05 ha sample plots in 2007. | |||
| Variables | Mean | Min–Max | Standard deviation |
| Volume of living trees [m3 ha-1] | 375 | 131–724 | 170 |
| Density of living trees [trees ha-1] | 520 | 80–1205 | 287 |
| Basal area of living trees [m2 ha-1] | 37.9 | 16.4–63.2 | 13.4 |
| Sapling density [individuals ha-1] | 700 | 0–2600 | 741 |
| Total volume of coarse woody debris [m3 ha-1] | 180 | 45–422 | 104 |
| Volume of fallen deadwood and stumps [m3 ha-1] | 65 | 12–172 | 48 |
| Height of stumps [m] | 0.55 | 0.15–1.20 | 0.25 |
| Canopy closure [%] | 41.2 | 10–85 | 22.7 |
| Tree losses [m3 ha-1 year-1] (over the past 15 years) | 7.0 | 0.0–20.0 | 5.7 |
| Slope of sample plot [degrees] | 17.8 | 0–30 | 8.0 |
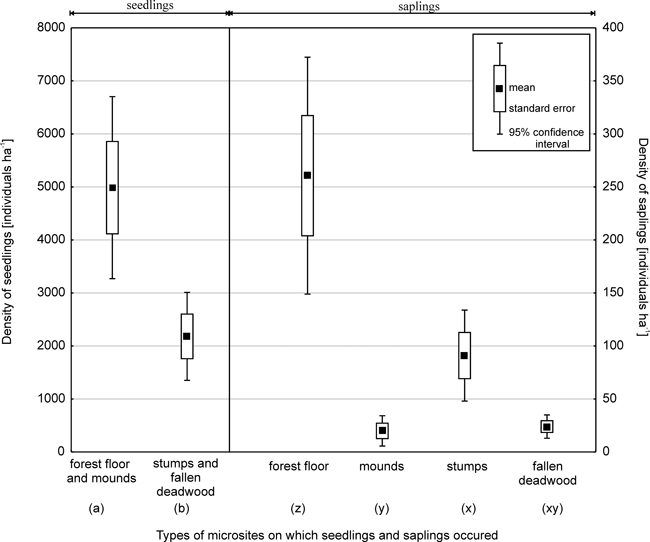
Fig. 2. Density of Picea seedling and saplings (with a diameter at breast height of less than 4 cm) on different microsites.
Note: Values with different letters differ significantly at p < 0.05 as evaluated using the Tukey post-hoc test. Two
separate analyses were conducted for seedlings and saplings.
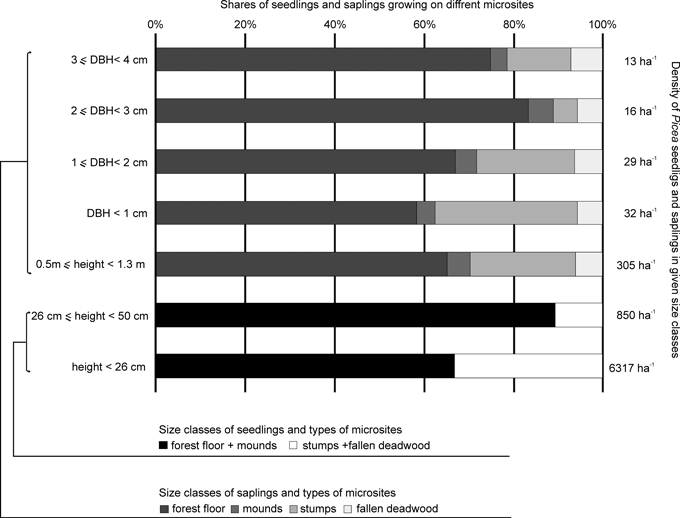
Fig. 3. Density and shares of the various size classes of Picea seedlings and saplings with a DBH (diameter at breast height) of less than 4 cm on different microsites.
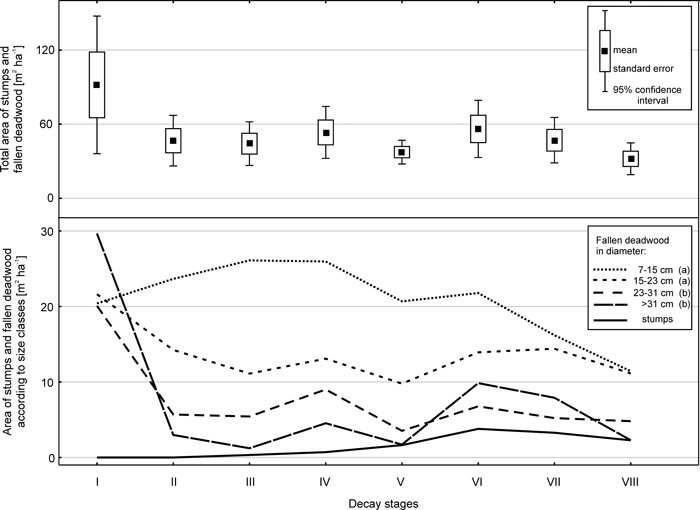
Fig. 4. Total area of stumps and fallen deadwood in the various decay stages (top chart) and areas of those microsites depending on size class and decay stage (bottom chart). Results of the Tukey test are given next to the size classes of fallen deadwood in the chart legend.
| Table 4. Spearman correlation matrix of independent variables (characteristics of 20 sample plots). | |||||||||
| Basal area of living trees | Density of living trees | Volume of living trees | Tree losses over 15 years | Canopy closure | Sapling density (all species) | Slope of sample plot | Volume of fallen deadwood and stumps | Total volume of coarse woody debris | |
| Basal area of living trees | 1.000 | ||||||||
| Density of living trees | 0.245 | 1.000 | |||||||
| Volume of living trees | 0.932*** | 0.084 | 1.000 | ||||||
| Tree losses over 15 years | -0.414 | -0.545* | -0.313 | 1.000 | |||||
| Canopy closure | 0.430 | 0.724*** | 0.288 | -0.612** | 1.000 | ||||
| Sapling density (all species) | -0.242 | -0.378 | -0.165 | 0.096 | -0.169 | 1.000 | |||
| Slope of sample plot | 0.242 | -0.141 | 0.225 | 0.006 | -0.100 | 0.541* | 1.000 | ||
| Volume of fallen deadwood and stumps | -0.206 | -0.673** | -0.134 | 0.597** | -0.716*** | 0.265 | 0.260 | 1.000 | |
| Total volume of coarse woody debris | -0.223 | -0.658** | -0.104 | 0.765*** | -0.650** | 0.224 | 0.238 | 0.853*** | 1.000 |
| Significance: *p < 0.05; **p < 0.01, ***p < 0.001. | |||||||||
| Table 5. Density of seedlings on woody microsites in different decay stages, according to diameter of fallen deadwood and stumps (wood in decay stages I–II was not taken into account). | |||||||||||
| Number of coarse woody debris pieces | Height of Picea seedlings < 26 cm | 26 cm ≤ height of Picea seedlings < 50 cm | |||||||||
| Mean | Median | Top quartile | Max | Mean | Median | Top quartile | Max | ||||
| individuals / m2 | |||||||||||
| Decay stage of stumps and fallen deadwood | III | (a) | 137 | 0.06 | 0.0 | 0.0 | 7.6 | 0.00 | 0.0 | 0.0 | 0.0 |
| IV | (ab) | 162 | 0.48 | 0.0 | 0.0 | 24.9 | 0.00 | 0.0 | 0.0 | 0.0 | |
| V | (ab) | 162 | 1.23 | 0.0 | 0.0 | 35.3 | 0.28 | 0.0 | 0.0 | 35.3 | |
| VI | (bc) | 189 | 1.90 | 0.0 | 0.0 | 52.6 | 0.27 | 0.0 | 0.0 | 20.8 | |
| VII | (bc) | 144 | 2.09 | 0.0 | 0.0 | 46.8 | 0.04 | 0.0 | 0.0 | 5.4 | |
| VIII | (c) | 98 | 3.77 | 0.0 | 0.0 | 65.1 | 0.22 | 0.0 | 0.0 | 10.0 | |
| Size class of fallen deadwood | 7–14.9 cm | (a) | 449 | 0.22 | 0.0 | 0.0 | 15.8 | 0.00 | 0.0 | 0.0 | 0.0 |
| 15–22.9 cm | (b) | 150 | 0.95 | 0.0 | 0.0 | 49.7 | 0.03 | 0.0 | 0.0 | 4.7 | |
| 23–30.9 cm | (c) | 59 | 2.71 | 0.0 | 1.9 | 36.0 | 0.28 | 0.0 | 0.0 | 10.0 | |
| ≥ 31 cm | (c) | 41 | 3.51 | 0.0 | 4.7 | 22.2 | 0.29 | 0.0 | 0.0 | 5.4 | |
| Diameter of stumps | 10–14.9 cm | (a) | 51 | 0.00 | 0.0 | 0.0 | 0.0 | 0.00 | 0.0 | 0.0 | 0.0 |
| 15–22.9 cm | (a) | 50 | 2.81 | 0.0 | 0.0 | 52.6 | 0.71 | 0.0 | 0.0 | 35.3 | |
| 23–30.9 cm | (a) | 33 | 3.56 | 0.0 | 0.0 | 32.5 | 0.00 | 0.0 | 0.0 | 0.0 | |
| ≥ 31 cm | (b) | 59 | 8.69 | 0.0 | 9.3 | 65.1 | 0.92 | 0.0 | 0.0 | 20.8 | |
| Note: Values designated with different letters differ significantly at p < 0.05 as evaluated by the nonparametric Kruskal–Wallis test corrected with a post hoc test for the number of comparisons. Analyses were conducted for total number of seedlings (small and large). | |||||||||||
| Table 6. Results of logistic regression analysis of the probability of Picea seedling occurrence on fallen deadwood on sample plots. | ||||
| Independent variable | Evaluation (standard error) | Wald chi-square | Odds ratio (95% confidence interval) | p |
| Decay stage [1–8] | 0.705 (0.082) | 73.7 | 2.02 (1.72-2.38) | 0.001 |
| Diameter of deadwood [cm] | 0.085 (0.016) | 27.3 | 1.09 (1.05-1.12) | 0.001 |
| Volume of living trees [m3 0.05 ha-1] | 0.047 (0.018) | 6.9 | 1.05 (1.01-1.09) | 0.01 |
| Number of living trees [trees 0.05 ha-1] | -0.105 (0.018) | 33.8 | 0.90 (0.87-0.93) | 0.001 |
| Sapling density [trees 0.05 ha-1] | -0.012 (0.006) | 3.9 | 0.99 (0.98-1.00) | 0.05 |
| Land slope [°] | -0.063 (0.028) | 4.9 | 0.94 (0.89-0.99) | 0.05 |
| Constant | -4.327 (0.779) | 30.9 | 0.001 | |
| Quality characteristics of the model: Likelihood-ratio test: χ2 = 217; p < 0.0001. | ||||
| Coefficients: McFadden’s R2 – 0.409, Nagelkerke R2 – 0.344, Cragg-Uhler (Nagelkerke) R2 – 0.477. | ||||
| The model correctly predicted results in 95% of the cases. Tolerance values for explanatory variables exceeded 0.25. The mean value for standardized Pearson’s residuals was -0.005, standard deviation: 0.884; more than 95% of results were within 2 standard deviations. | ||||
| Table 7. Results of logistic regression analysis of the probability of Picea seedling occurrence on stumps on sample plots. | ||||
| Independent variable | Evaluation (standard error) | Wald chi-square | Odds ratio (95% confidence interval) | p |
| Diameter of stump [cm] | 0.128 (0.024) | 27.9 | 1.14 (1.08–1.19) | 0.001 |
| Height of stump [cm] | -0.066 (0.019) | 12.1 | 0.94 (0.90–0.97) | 0.001 |
| Sapling density [individuals 0.05 ha-1] | 0.026 (0.009) | 8.1 | 1.03 (1.00–1.04) | 0.01 |
| Constant | -3.066 (0.988) | 9.6 | 0.01 | |
| Quality characteristics of the model: Likelihood-ratio test: χ2 = 73; p < 0.0001. | ||||
| Coefficients: McFadden’s R2 – 0.399, Nagelkerke R2 – 0.291, Cragg-Uhler (Nagelkerke) R2 – 0.514. | ||||
| The model correctly predicted the results in 88% of the cases. Tolerance values for explanatory variables exceeded 0.25. The mean value of standardized Pearson’s residuals was -0.033, standard deviation: 0.889; 95% of the results were within 2 standard deviations. | ||||