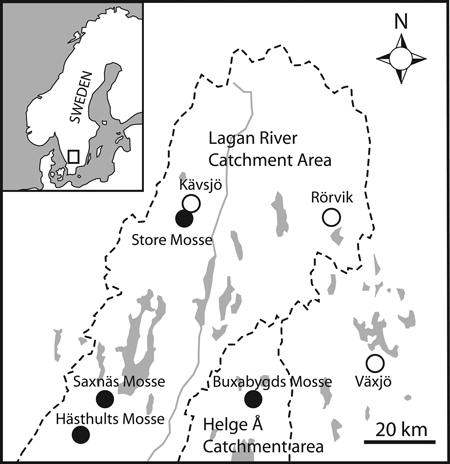
Fig. 1. Location of the study sites (black circles) and meteorological stations (white circles) within the study area in southern Sweden (inset). The dashed lines show the Lagan River and Helge Å catchment areas whereas lakes and rivers are shown in grey.
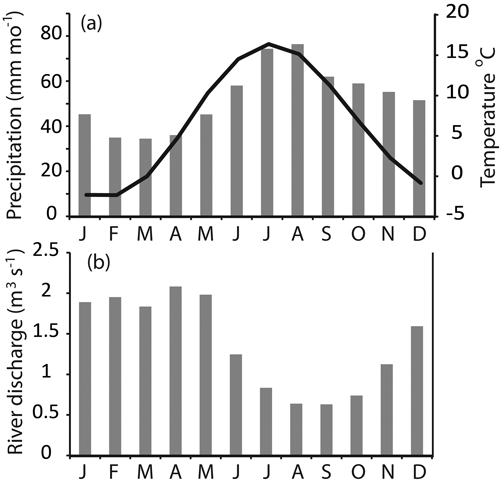
Fig. 2. (a) Average monthly precipitation (grey bars) and temperature (black line) recorded at the Växjö meteorological station for the years 1860 to 2013. (b) Average monthly river discharge data recorded at the Rörvik measuring station for the years 1909 to 2012.
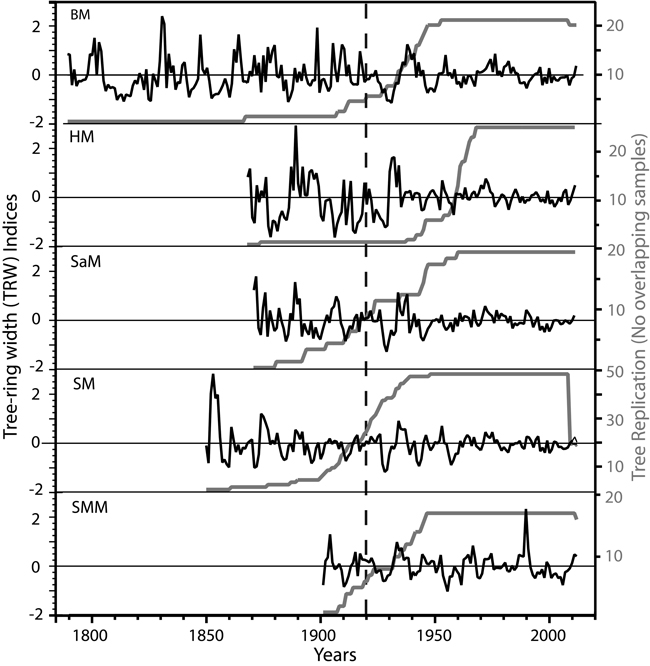
Fig. 3. The black curves show standardized tree-ring width (TRW) chronologies (dimensionless indices) from the raised bogs Buxabygds Mosse (BM), Hästhults Mosse (HM), Saxnäs Mosse (SaM), Store Mosse (SM), and mineral soil adjacent to Store Mosse (SMM). The grey curves show sample replication, and the vertical dashed line show the onset of the common period used for the correlation analyses shown in Fig 4 and 5.
| Table 1. The table show number of trees used in each tree-ring width (TRW) chronology (No), length of the TRW chronologies (yrs), the period each TRW chronology covers, the period with EPS above 0.85, series inter-correlation (r), and average (Ave), maximum (Max) as well as minimum (Min) TRW (mm) for the EPS > 0.85 periods. Two TRW chronologies are presented from Store Mosse, one for the bog trees (B) and one for the mineral soil trees (MS). | ||||
| Site | Trees (No) / Length (yrs) | Total period / EPS > 0.85 | Series inter- correlation | TRW (mm) Ave / Max / Min |
| Buxabygds Mosse | 21 / 227 | 1785–2011 / 1920–2011 | 0.530 | 0.85 / 1.79 / 0.22 |
| Hästhults Mosse | 25 / 144 | 1868–2011 / 1960–2011 | 0.506 | 1.11 / 3.24 / 0.32 |
| Saxnäs Mosse | 20 / 141 | 1871–2011 / 1915–2011 | 0.451 | 0.52 / 1.26 / 0.16 |
| Store Mosse (B) | 49 /163 | 1850–2012 / 1910–2012 | 0.513 | 0.68 / 1.56 / 0.28 |
| Store Mosse (MS) | 18 / 111 | 1902–2012 / 1915–2012 | 0.566 | 1.86 / 3.58 / 0.77 |
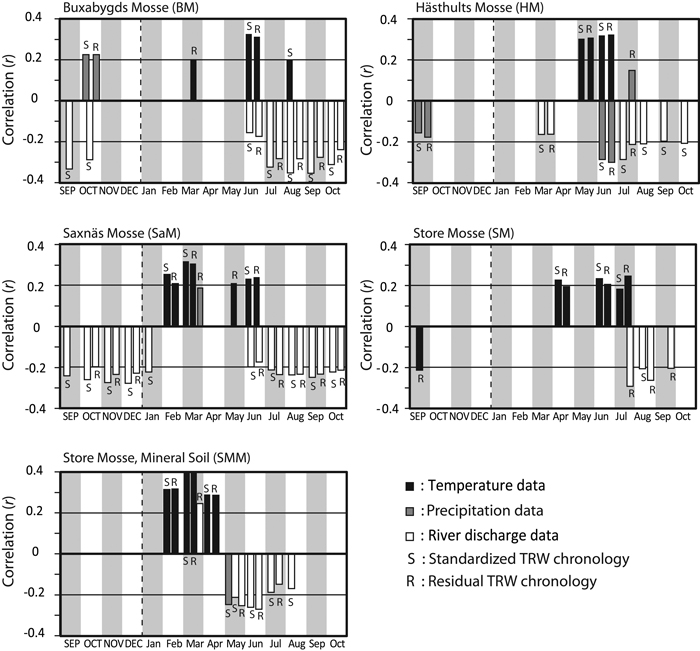
Fig. 4. Correlation analyses between tree-ring width (TRW) chronologies, average monthly temperature, total monthly precipitation and river discharge. The period September of the previous year (n–1) to October in the considered year (n) during the period 1920 to 2011 was used for all correlations analyses presented. Correlation values are displayed only if significance level corresponding to p < 0.05 is reached.
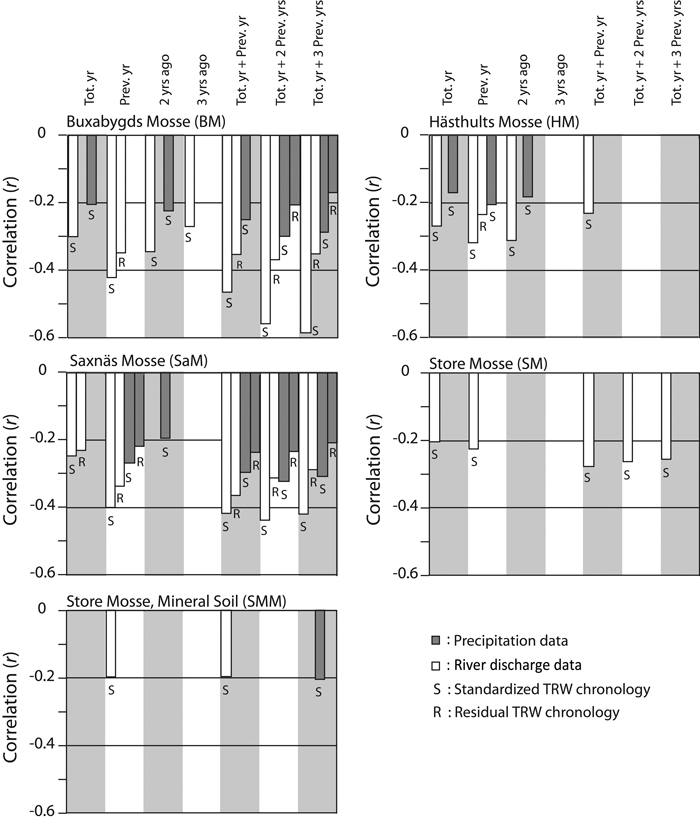
Fig. 5. Correlation analyses between tree-ring width (TRW) chronologies, total precipitation and river discharge for the entire year (Total yr.), for the preceding three years individually (Prev. yr., 2 yrs. ago, 3 yrs. ago), for the year plus previous year (Total yr. + prev. yr.), for the year plus the two previous years (Total yr. + Prev. 2 yrs.) and the year plus the three previous years (Total yr. + Prev. 3 yrs.). The period 1920–2011 was used during all correlation analyses presented and values are displayed only if a significance level corresponding to p < 0.05 is reached.
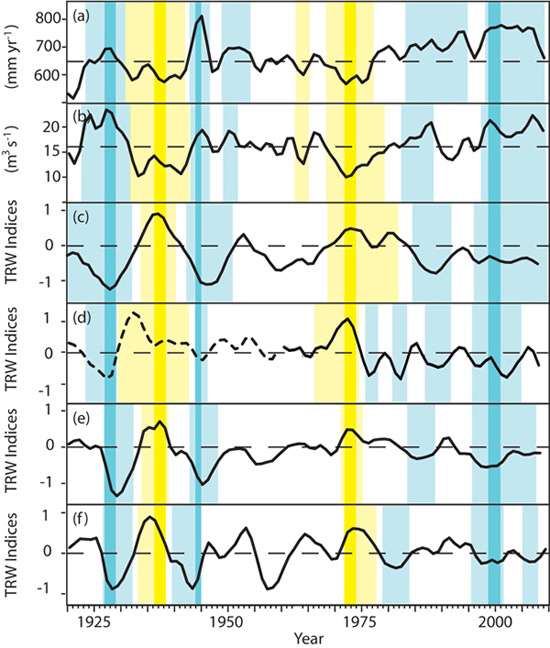
Fig. 6. Multi-year comparison between meteorological data and tree-ring width (TRW) chronologies. (a) Precipitation data from the meteorological station in Växjö, (b) river discharge data from the measuring station in Rörvik, (c) TRW data from Buxabygds Mosse, (d) Hästhults Mosse, (e) Saxnäs Mosse, and (f) Store Mosse. All records are smoothed using a 3-year Gaussian filter and unreliable segments are dashed. Moist periods are highlighted in blue whereas dry periods are highlighted in yellow. Periods showing synchronicity between all records are highlighted with darker colours.