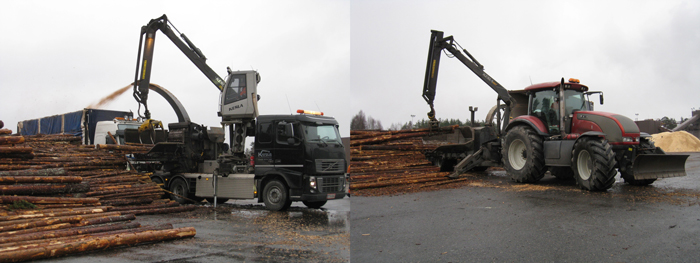
Fig. 1. Chipping Scots pine pulpwood with Kesla C 1060 A and Kesla C 4560 LF chippers at the asphalted wood terminal in Joensuu. The chipping experiment started with the Kesla C 1060 A chipper.
| Table 1. Statistical characteristics of regression models. | ||||||||||
| Productivity model | Dependent variable | r2 | F-test/F-value p | N | Term | Constant/Coefficient | t-test | |||
| Estimate | Std. error | t-value | p | |||||||
| Chipping productivity of the Kesla C 1060 A powered by a Volvo FH 750 | PChipping1060 | 0.67 | 12.332 0.013 | 8 | Constant ln(x1060) | –127429.105 30132.281 | 45182.677 8580.522 | –2.820 3.512 | 0.030 0.013 | |
| Chipping productivity of the Kesla C 4560 LF powered by a Valtra S 280 | PChipping4560 | 0.62 | 9.600 0.021 | 8 | Constant ln(x4560) | –438.103 4100.515 | 6440.559 1323.463 | –0.068 3.098 | 0.948 0.021 | |
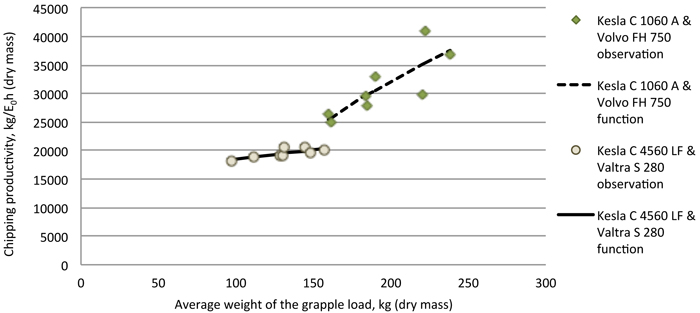
Fig. 2. Chipping productivity of Kesla C 1060 A and Kesla C 4560 LF chippers (kg E0h–1) according to the weight of the grapple load (kg).
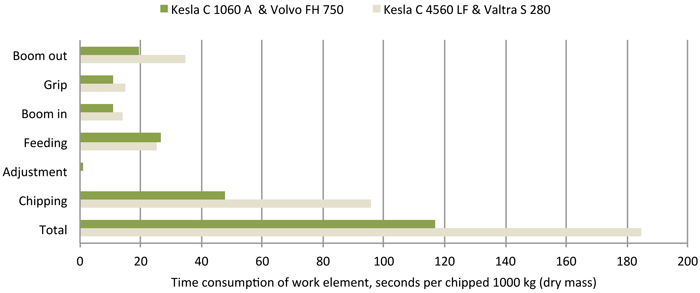
Fig. 3. Time consumption of work elements per chipped 1000 kg (dry mass) with the Kesla C 1060 A and the Kesla C 4560 LF chippers.
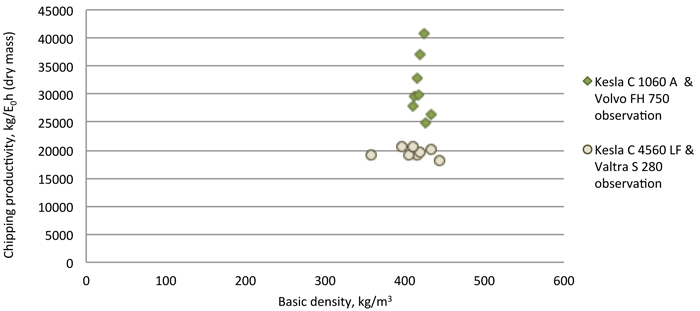
Fig. 4. Chipping productivity (kg E0h–1) of the Kesla C 1060 A and the Kesla C 4560 LF chippers according to basic density (kg m–3) of chipped wood material.
| Table 2. Moisture content (%), calorific value (MJ kg–1), basic density (kg m–3) and ash content (%) of different storage time groups of pulpwood. | ||||||||
| Age of storage, months | Moisture content, % | Calorific value MJ kg–1 | Basic density kg m–3 | Ash content, % | ||||
| Kesla C 1060 A | Kesla C 4560 LF | Kesla C 1060 A | Kesla C 4560 LF | Kesla C 1060 A | Kesla C 4560 LF | Kesla C 1060 A | Kesla C 4560 LF | |
| 2 | 55.8 | 54.4 | 20.66 | 20.70 | 434 | 443 | 0.43 | 0.43 |
| 4 | 47.0 | 46.8 | 20.35 | 20.61 | 417 | 416 | 0.62 | 0.38 |
| 7 | 41.6 | 40.9 | 20.32 | 20.32 | 411 | 406 | 0.63 | 0.58 |
| 9 | 45.7 | 45.3 | 20.56 | 20.54 | 412 | 396 | 0.54 | 0.42 |
| 12 | 56.0 | 50.3 | 20.36 | 20.54 | 418 | 420 | 0.47 | 0.35 |
| 15 | 47.2 | 47.4 | 20.43 | 20.29 | 420 | 410 | 0.46 | 0.41 |
| 17 | 40.7 | 45.6 | 20.28 | 20.32 | 426 | 433 | 0.49 | 0.47 |
| 21 | 37.0 | 38.6 | 20.37 | 20.42 | 425 | 358 | 0.49 | 0.39 |
| Average | 46.38 | 46.16 | 20.42 | 20.47 | 420 | 410 | 0.52 | 0.43 |
| Standard deviation | 6.82 | 4.95 | 0.13 | 0.15 | 7.69 | 25.83 | 0.08 | 0.07 |
| Table 3. Yield of extractives (% of dry mass) and volatiles (% of extractives) of pulpwood in different storage time groups with the Kesla C 1060 A and the Kesla C 4560 LF chippers. | |||||
| Extractives | Volatiles | ||||
| Age of storage, months | Chipper | Lipophilic yield, % | Hydrophilic yield, % | In total, % | % |
| 2 | Kesla C 1060 A | 5.90 | 1.14 | 7.04 | 84.9 |
| 4 | 4.68 | 1.24 | 5.92 | 83.8 | |
| 7 | 3.28 | 1.27 | 4.55 | 84.4 | |
| 9 | 4.31 | 1.26 | 5.57 | 83.6 | |
| 12 | 4.53 | 1.10 | 5.63 | 83.3 | |
| 15 | 3.56 | 1.06 | 4.62 | 84.8 | |
| 17 | 4.09 | 1.36 | 5.45 | 83.4 | |
| 21 | 3.64 | 1.27 | 4.91 | 84.1 | |
| Average | 5.46 | 84.04 | |||
| Standard deviation | 0.81 | 0.62 | |||
| 2 | Kesla C 4560 LF | 5.95 | 1.13 | 7.08 | 83.9 |
| 4 | 4.86 | 1.09 | 5.95 | 84.4 | |
| 7 | 4.24 | 1.08 | 5.31 | 83.4 | |
| 9 | 4.31 | 1.22 | 5.53 | 84.5 | |
| 12 | 4.60 | 0.97 | 5.57 | 84.3 | |
| 15 | 3.96 | 0.92 | 4.88 | 84.3 | |
| 17 | 3.18 | 1.32 | 4.50 | 84.4 | |
| 21 | 4.57 | 1.00 | 5.58 | 84.5 | |
| Average | 5.55 | 84.21 | |||
| Standard deviation | 0.77 | 0.38 | |||
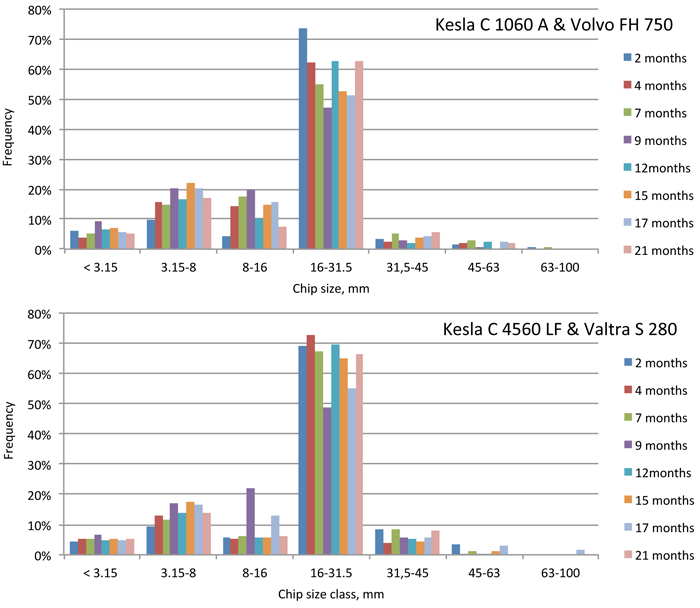
Fig. 5. Chip size distribution for the Kesla C 1060 A chipper (above) and the Kesla C 4560 LF chipper (below) with different storage times (2–21 months from logging).
| Table 4. Effect of storage time on chip size distribution. | ||||
| Effect of storage time | ||||
| Fraction, mm | df | Distribution, percentage, Mean | Std. deviation | P-value |
| 63–100 | 7 | 0.19 | 0.48 | 0.56 |
| 45–63 | 7 | 1.45 | 1.09 | 0.35 |
| 31.5–45 | 7 | 4.98 | 2.05 | 0.52 |
| 16–31.5 | 7 | 61.38 | 8.60 | 0.17 |
| 16–8.0 | 7 | 10.88 | 5.82 | 0.19 |
| 3.15–8 | 7 | 15.54 | 3.62 | 0.10 |
| < 3.15 | 7 | 5.62 | 1.25 | 0.42 |
| Table 5. Effect of chipper type and sieve mesh size on chip size distribution. | ||
| Effect of chipper type | ||
| Fraction, mm | df | P-value |
| 63–100 | 1 | 0.644 |
| 45–63 | 1 | 0.752 |
| 31.5–45 | 1 | 0.007 |
| 16–31.5 | 1 | 0.115 |
| 16–8.0 | 1 | 0.115 |
| 3.15–8 | 1 | 0.115 |
| < 3.15 | 1 | 0.292 |