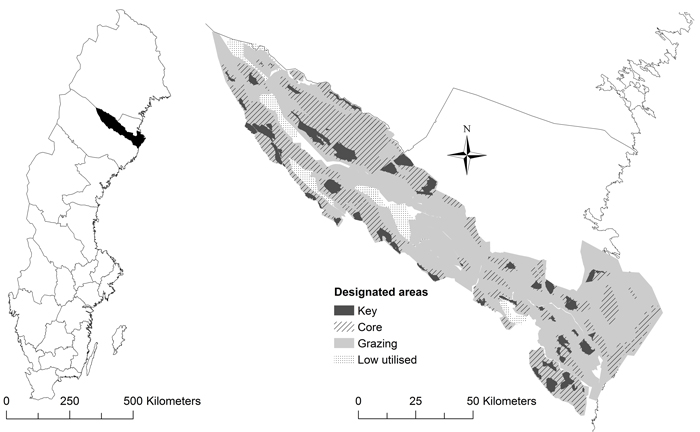
Fig. 1. The area used by Malå Sami village with designated areas of importance for reindeer husbandry. Location in Sweden (left) and designated areas (right).
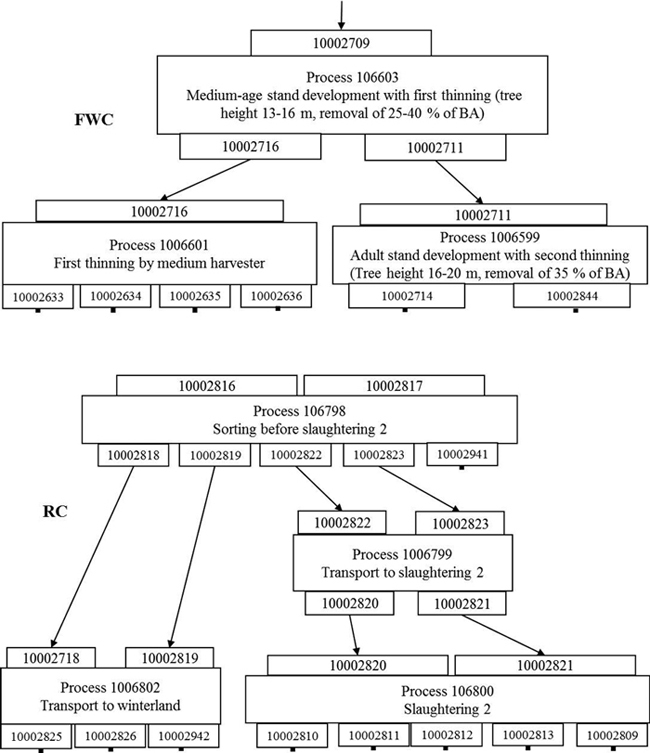
Fig. 2. Part of the Forest Wood Chain (above) with medium age stand development process followed by first thinning with a medium harvester and adult stand development and part of the Reindeer Husbandry Chain (below) with the processes of sorting, transport and slaughtering.
| Table 1. List of sustainability indicators. | ||
| Indicator (type) | Indicator Unit | Process unit |
| GVA1 (Economic) | € | m3ub or kg meat |
| Production costs (Economic) | € | m3ub or kg meat |
| FTE2 (Social) | Number of full time working persons | 1000 m3ub or kg meat |
| Fatal accidents (Social) | Number of accidents | 1000 m3ub or kg meat |
| GHG3 (Environmental) | kg CO2eq | m3ub or kg meat |
| 1 Gross Value Added 2 Full Time Employment 3 Green House Gas | ||
| Table 2. Absolute number of hunted moose, reindeer (winter herd), born calves, traffic losses and slaughtering for the scenarios. | ||||||
| Scenario | Hunted moose | Winter stem reindeer1 | Born calves | Traffic losses | Other losses2 | Slaughtered |
| REFERENCE NATURE COMBINED | 16 | 6200 | 4200 | 160 | 1540 | 25003 |
| REINDEER | 16 | 6400 | 4335 | 160 | 13404 | 28355 |
| 1 70% cows 2 Predators, starvation and natural causes 3 64% calves 4 200 less losses due to better and richer grazing 5 69% calves | ||||||
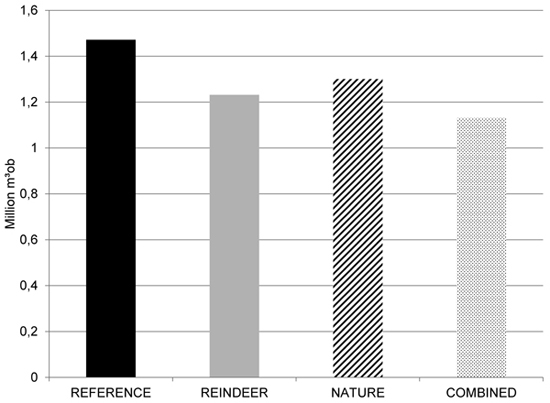
Fig. 3. Development of potential mean annual harvest (volume, million m3ob) from 2009 to 2034 due to prescribed management in REFERENCE and the scenarios.
| Table 3. Calculated potential wood flow from forests to industry in millions of cubic meters, m3ub (under bark, harvested volume) in studied area. | |||||||
| Scenario | Saw timber | Pulp wood | |||||
| Thinning | Final felling | All sawn timber | Thinning | Final felling | All pulpwood | Total | |
| REFERENCE | 0.11 | 0.32 | 0.43 | 0.25 | 0.53 | 0.78 | 1.21 |
| REINDEER | 0.12 | 0.25 | 0.37 | 0.25 | 0.39 | 0.64 | 1.01 |
| NATURE | 0.12 | 0.25 | 0.37 | 0.24 | 0.45 | 0.69 | 1.06 |
| COMBINED | 0.10 | 0.23 | 0.34 | 0.21 | 0.38 | 0.59 | 0.93 |
| Table 4. Indicators and its values reflecting the accumulated performance of the FWC (Forest Wood Chain) and RC (Reindeer Husbandry Chain) in REFERENCE and scenarios. | |||||
| Scenario | GVA1 million € | Prod. costs, million € | FTE2, persons | GHG3, 1000 tonne CO2 equivalents | Risk for fatal accidents per year |
| FWC | |||||
| REFERENCE | 54.2 | 92.8 | 659 | 358 | 0.33 |
| REINDEER | 41.1 | 67.0 | 508 | 277 | 0.26 |
| NATURE | 52.7 | 90.0 | 585 | 350 | 0.33 |
| COMBINED | 38.6 | 78.5 | 479 | 262 | 0.24 |
| RC | |||||
| REFERENCE | 0.90 | 0.46 | 12 | 20.2 | 0.18 |
| REINDEER | 1.09 | 0.34 | 13 | 20.9 | 0.18 |
| NATURE and COMBINED | 1.05 | 0.33 | 12 | 20.2 | 0.18 |
| 1 Gross Value Added 2 Full Time Employment 3 Green House Gas | |||||
| Table 5. Indicator values reflecting the contribution of the chain components to the FWC (Forest Wood Chain) from forest to industry processes in REFERENCE. | |||||
| Components | GVA1 million € | Prod. costs, million € | FTE2, persons | GHG3, 1000 tonne CO2 equiv. | Risk for fatal accidents per year |
| TOTAL | 54.2 | 92.8 | 659 | 357.7 | 0.33 |
| Industry | 30.8 | 57.3 | 365 | 337.4 | 0.05 |
| Forest operations (Transports and Logging) | 27.4 | 32.9 | 253 | 20.0 | 0.29 |
| Transports | –9,0 | 13.1 | 70 | 14,1 | 0.03 |
| Logging | 36.4 | 19.8 | 183 | 5.9 | 0.26 |
| Forest Resource Management | –3.9 | 2.6 | 41 | 0.3 | 0.00 |
| 1 Gross Value Added 2 Full Time Employment 3 Green House Gas | |||||
| Table 6. Indicator values reflecting the contribution of the chain components to the FWC (Forest Wood Chain) from forest to industry processes in REINDEER. | |||||
| Components | GVA1 million € | Prod. costs, million € | FTE2, persons | GHG3, 1000 tonne CO2 equiv. | Risk for fatal accidents per year |
| TOTAL | 41.1 | 67.0 | 508 | 276.5 | 0.26 |
| Industry | 23.6 | 44.1 | 275 | 260.2 | 0.03 |
| Forest operations (Transports and Logging) | 20.6 | 21.2 | 202 | 15.9 | 0.23 |
| Transports | –7.6 | 11.2 | 52 | 11,5 | 0.03 |
| Logging | 28.6 | 10.0 | 150 | 4,4 | 0.20 |
| Forest Resource Management | –3.1 | 1.7 | 31 | 0.3 | 0.00 |
| 1 Gross Value Added 2 Full Time Employment 3 Green House Gas | |||||
| Table 7. Indicator values reflecting the contribution of the chain components to the FWC from forest to industry processes in NATURE. | |||||
| Components | GVA1 million € | Prod. costs, million € | FTE2, persons | GHG3, 1000 tonne CO2 equiv. | Risk for fatal accidents per year |
| TOTAL | 52.7 | 95.4 | 585 | 350 | 0.33 |
| Industry | 29.8 | 55.6 | 346 | 330 | 0.04 |
| Forest operations (Transports and Logging) | 26.2 | 37.6 | 239 | 20 | 0.29 |
| Transports | –9.7 | 14.1 | 64 | 11 | 0.05 |
| Logging | 35.9 | 23,5 | 174 | 9 | 0.24 |
| Forest Resource Management | –3.3 | 2.0 | 33 | 0 | 0.00 |
| 1 Gross Value Added 2 Full Time Employment 3 Green House Gas | |||||
| Table 8. Indicator values reflecting the contribution of the chain components to the FWC from forest to industry processes in COMBINED. | |||||
| Components | GVA1 million € | Prod. costs, million € | FTE2, persons | GHG3, 1000 tonne CO2 equiv. | Risk for fatal accidents per year |
| TOTAL | 38.6 | 78.5 | 479 | 262.3 | 0.24 |
| Industry | 22.5 | 42.0 | 263 | 247.2 | 0.03 |
| Forest operations (Transports and Logging) | 19.2 | 34.8 | 185 | 14.9 | 0.21 |
| Transports | –7.1 | 10.4 | 45 | 10.6 | 0.03 |
| Logging | 26.3 | 24.4 | 140 | 4,3 | 0.18 |
| Forest Resource Management | –3.05 | 3.0 | 31 | 0.3 | 0.00 |
| 1 Gross Value Added 2 Full Time Employment 3 Green House Gas | |||||
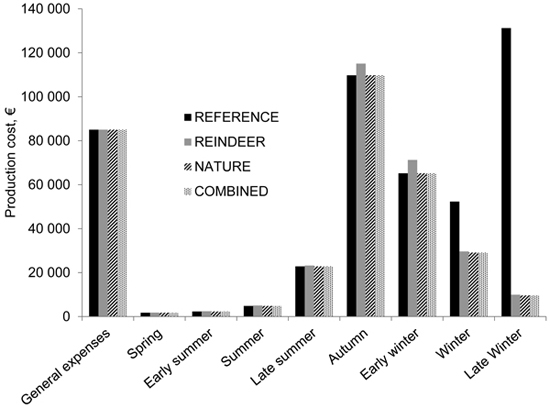
Fig. 4. Production costs (€) for the Sami village distributed on general expenses and reindeer husbandry seasons.
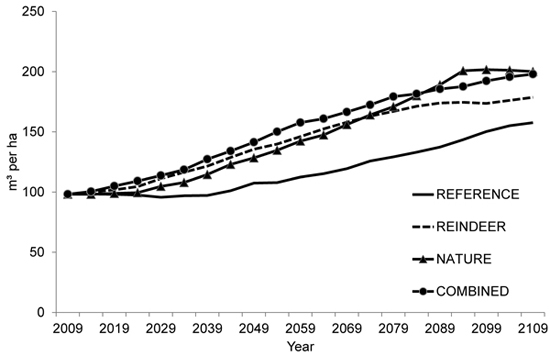
Fig. 5. Development of growing stock (volume, m3 per ha) from 2009 to 2108 for REFERENCE and each scenario.
| Table 9. Annual sequestration (trees above ground) and emissions from FWC1 2009–2059 in the study area, 1000 tonnes CO2 equivalents. | |||
| Scenario | Sequestration | Emissions | Quota (sequestration/ emission) |
| REFERENCE | 125 | 358 | 0.35 |
| RENDEER | 420 | 277 | 1.52 |
| NATURE | 522 | 351 | 1.49 |
| COMBINED | 387 | 262 | 1.47 |
| 1 Forest Wood Chain | |||