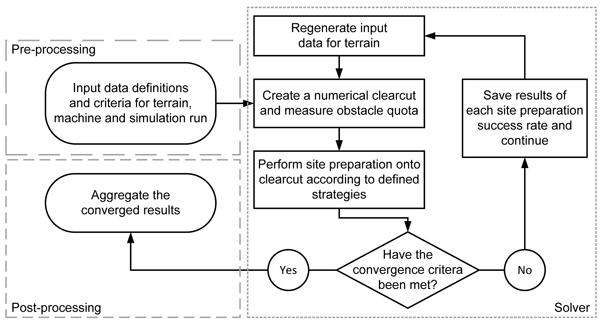
Fig. 1. Flow chart of the conducted simulation following the Monte Carlo method.
| Table 1. Five different terrain model configurations based on Ersson et al. (2013) and Berg (1982). Slash residues is further added on these terrain models. | |||||
| Terrain model config. number | Description | Surface boulder amount [Area %] | Stone amount [Area %] | Stump amount [Area %] | Boulder quota |
| 0 | Typical southern Swedish clearcut | 3 | 41 | 4 | ~55% |
| 1 | Few stumps, few stones, no surface boulders. | 0 | 35 | 4 | ~25% |
| 2 | Few stumps, many stones, many surface boulders | 5 | 51 | 4 | ~70% |
| 3 | Many stumps, few stones, no surface boulders | 0 | 35 | 10 | ~25% |
| 4 | Many stumps, many stones, many surface boulders | 5 | 51 | 10 | ~75% |
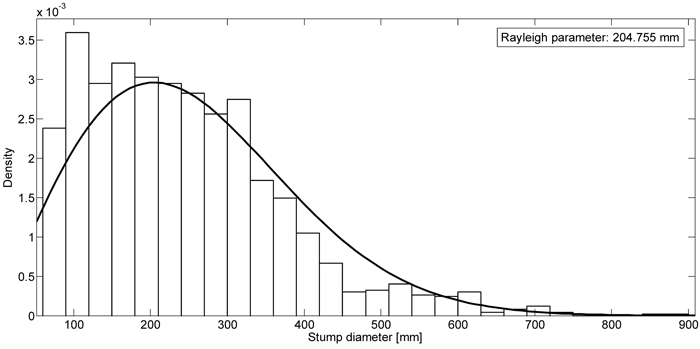
Fig. 2. Stump diameters of 12 stands ready for felling based on Herlitz (1975). The curve represents a Rayleigh distribution with a Rayleigh parameter set to 204.755 mm. The Rayleigh distribution was used to enable the (pseudo)random generator to choose from a continuous domain of values.
| Table 2. Slash input data for the terrain model based on Pettersson and Nordfjell (2007) and measures from clearcuts of previous spruce stands in southern Sweden with additional material from Lars Eliasson (Lars Eliasson, Skogforsk, pers. comm. 2013). | |||||
| Distribution type | Mean value | Standard deviation | High limit | Lower limit | |
| Average basal area [m2] | Normal (truncated) | 4.06 | 1.4 | 5.7 | 2.0 |
| Piles per 100 m strip road [-] | Uniform | 8.5 | - | 4 | 13 |
| Distance between strip roads [m] | Uniform | 13.45 | - | 12.5 | 14.4 |
| Table 3. Object positioning procedure and interrelations between the objects for the creation of the terrain model. | ||||
| Object type (Order of placement) | Boulder (1) | Stump (2) | Stone (3) | Slash (4) |
| Boulder (1) | Can not be placed over top of each other. | Doesn’t exist during boulder placement. | Doesn’t exist during boulder placement. | Doesn’t exist during boulder placement. |
| Stump (2) | ZRT can be placed over top of boulders, not stump. | Can not be inserted closer than 1 metre to another stump (Centre-to-Centre). | Doesn’t exist during stump placement. | Doesn’t exist during stump placement. |
| Stone (3) | Can not be placed under top of boulders. | Can not be placed under the stump centre point | Can not be placed over top of each other. | Doesn’t exist during stone placement. |
| Slash (4) | Can be placed over top of stones. | Can be placed over top of boulders. | Can be placed over top of stumps. | Slash piles never exist in same location. |
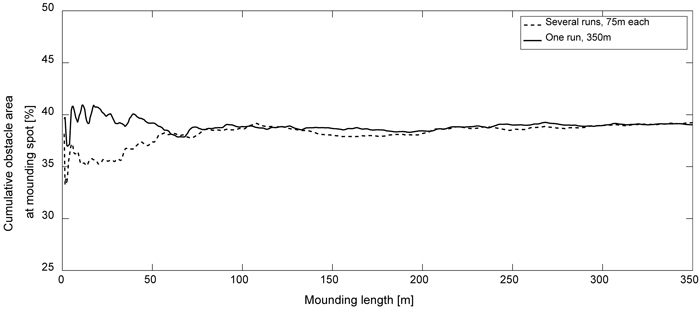
Fig. 3. Graph depicting two runs, one where 5 simulations were run 75 m each and put after one other (dashed line), and one simulation run 350 m (solid line). The simulations converged towards the same cumulative obstacle area at the mounding spots, which occur after around 250 metres.
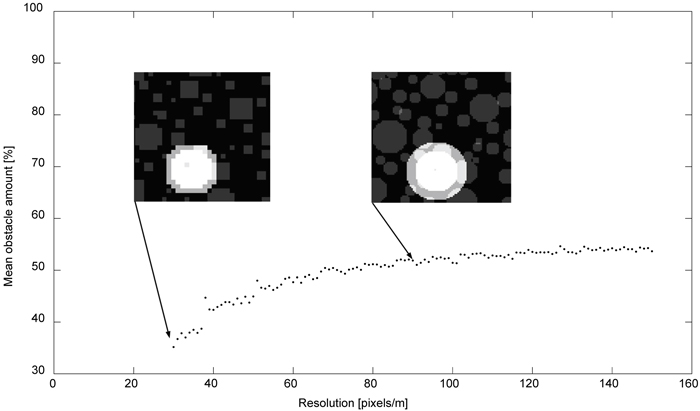
Fig. 4. Simulated mean obstacle amount (area percentage) as a function of detection resolution. A visual representation shows the difference between low-resoluted and high-resoluted clearcuts.
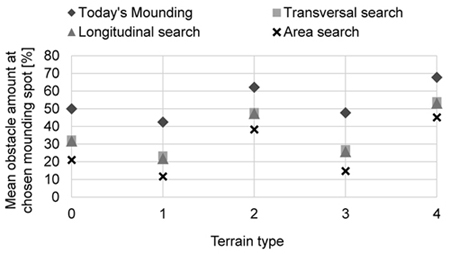
Fig. 5. Mean obstacle area at chosen mounding spots at different terrain models using four different strategies in choosing mounds.
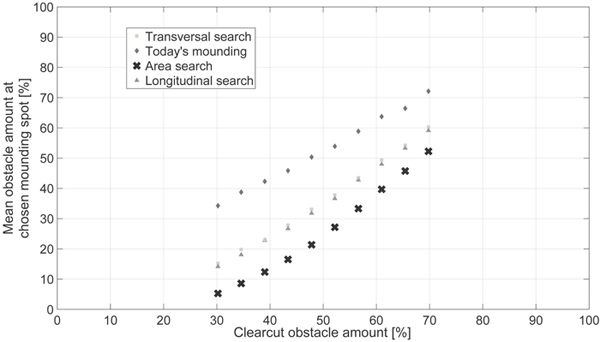
Fig. 6. Mean obstacle amount measured at mounding spots created at clearcuts with total obstacle amounts between 30% and 70%. The obstacles subsurface stones, surface boulders and stumps were linearly changed to range all terrain models 0–4 and more. Slash residue parameters were kept at the same rate throughout the simulations.