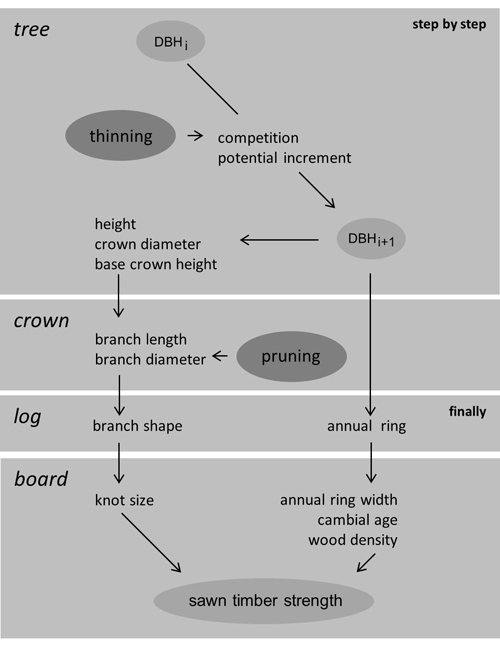
Fig. 1. Simulation of individual tree growth, finalised by logging and sawing; tree and crown components are computed within each time step; thinning and pruning are optional and occasional.
| Table 1. Equations of DBH growth given with parameterisation sample size and parameter values. View in new window/tab. |
| Table 2. Equations of tree height, crown shape, branch size and board strength given with parameterisation sample size and parameter values. View in new window/tab. |
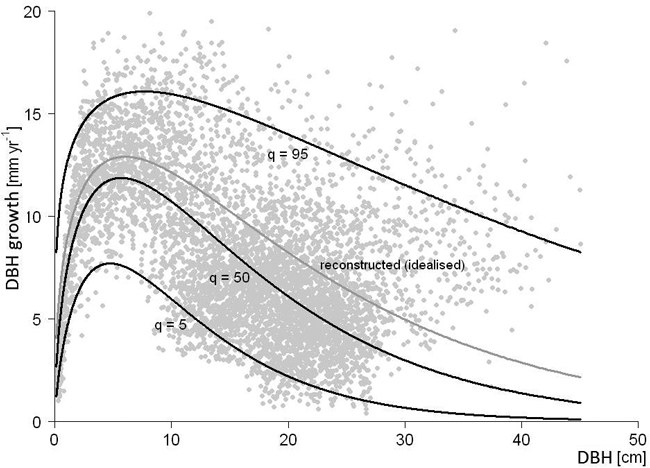
Fig. 2. Exemplary DBH growth reconstruction inferred from a first inventory DBH larger than the one resulting from the corresponding time integral over the 50% quantile; reconstructed growth is drawn in grey (idealised as 75% quantile); guiding quantiles q are drawn in black (5%, 50% and 95%).
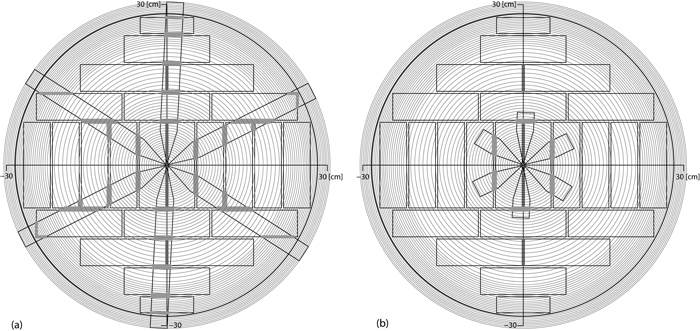
Fig. 3. Inner structure of boards resulting from application of a sawing pattern to simulated branches and annual rings from a stem 60 cm in diameter; if branches not pruned (a) and if pruned (b). View larger in new window/tab.
| Table 3. Crucial algorithm alternatives implemented in basic (B) and current (C) version. | |||||
| category of algorithm | focus of algorithm | presumed impact on board strength through | alternatives | version | |
| B | C | ||||
| evaluation of timber strength | structure to board strength | board strength | distance from pith, DEK1 | x | |
| juvenile and mature by cambial age, tKAR2 | x | ||||
| calibration of allometry | measured tree heights to parameters of height curve | dynamics of H/D ratio crown base height branch growth | generalist | x | |
| planting density specific | x | ||||
| 1 knot value from DIN 4074-1 (2012) 2 total knot area ratio from BS 4978 (2007) | |||||
| Table 4. Soil and climate properties of the experimental sites. | |||
| property | Ansbach shallow, dry, poor (Dry) | Heigenbrücken moist, fertile (Favourable) | |
| location | AMSL (m) | 460 | 415 |
| coordinates | 49°13´N, 10°33´E | 49°59´N, 09°22´E | |
| climate in growing season 1st of May to 30th of September | temperature (°C) 1) | 15.6 ± 0.4 | 15.3 ± 0.5 |
| precipitation (mm) 1) | 346 ± 106 | 379 ± 41 | |
| soil | type | sand (SI) | loamy sand (IS) |
| depth (cm) | 30 | > 200 | |
| 1 values based on the climate between the years 1998 and 2008 | |||
| Table 5. Stand properties in simulation setup for the evaluation of model versions; stand characteristics from survey 1989. | ||||||
| stand property | planting density (ha–1) | |||||
| Heigenbrücken (Favourable) | Ansbach (Dry) | |||||
| 1000 | 2000 | 4000 | 1000 | 2000 | 4000 | |
| QMD (cm) | 15 | 14 | 12 | 17 | 14 | 13 |
| absolute number of trees | 373 | 1286 | 1094 | 497 | 829 | 579 |
| absolute number of future crop trees | 86 | 155 | 108 | 84 | 70 | 44 |
| total area (ha) | 0.45 | 0.81 | 0.45 | 0.54 | 0.45 | 0.27 |
| number of stems (ha–1) | 829 | 1588 | 2431 | 920 | 1842 | 2144 |
| corresponding number of future crop trees (ha–1) | 191 | 191 | 240 | 156 | 156 | 163 |
| basal area (m² ha–1) | 15 | 24 | 25 | 20 | 27 | 26 |
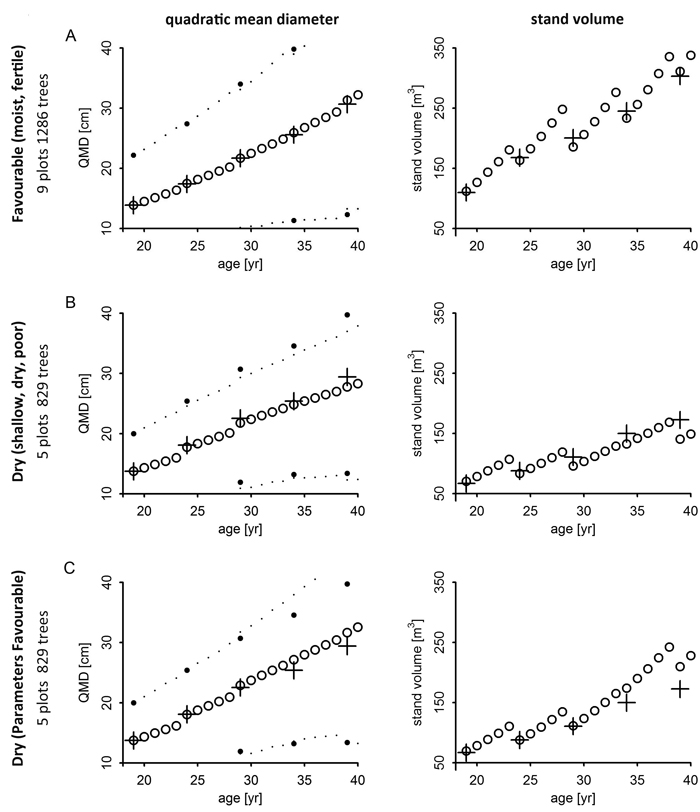
Fig. 4. QMD, DBH quantiles (2.5% and 97.5%) and total tree volume by site using site related parameterisation (rows A, B) and parameters from site Favourable on site Dry (row C); measured data mean given as +.
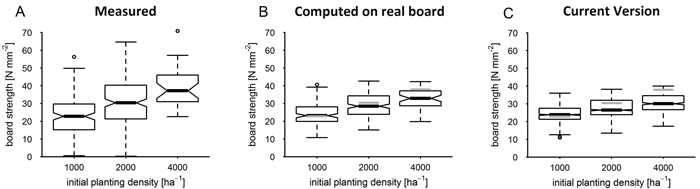
Fig. 5. Board strength at parameterisation site by planting density after 40 years as measured (A), as computed based on sample board structure (B) and as simulated by the current version; the boxplot notches correspond to the 95% confidence interval (CI) of the median; grey horizontal lines mark the median of measured data in diagrams of simulated result distributions. View larger in new window/tab.
| Table 6. Bias of real board at parameterisation site Favourable (Fav) given as CI range of bias (Nmm–1) by planting density (ha–1), top row as computed from real board (com), bottom row as simulated (sim). | |||||||||||||
| set | variable | mean | median | Q1 | Q3 | ||||||||
| 1000 | 2000 | 4000 | 1000 | 2000 | 4000 | 1000 | 2000 | 4000 | 1000 | 2000 | 4000 | ||
| Fav com | MBE | 1.13 | –1.55 | –6.96 | –0.03 | –1.63 | –4.55 | 5.08 | 2.93 | –3.94 | –1.79 | –6.12 | –8.43 |
| 0.99 | –1.71 | –1.71 | –0.25 | –1.80 | –4.82 | 4.91 | 2.67 | –4.26 | –2.05 | –6.35 | –8.78 | ||
| MABE | 1.30 | 1.74 | 6.94 | 1.34 | 1.89 | 4.81 | 5.06 | 2.95 | 4.34 | 2.22 | 6.32 | 8.80 | |
| 1.18 | 1.62 | 6.73 | 1.20 | 1.74 | 4.62 | 4.92 | 2.73 | 4.06 | 2.01 | 6.12 | 8.46 | ||
| Fav sim | MBE | 1.33 | –3.15 | –8.92 | 0.61 | –3.69 | –7.72 | 6.23 | 2.8 | –5.91 | –2.23 | –8.42 | –10.9 |
| 1.22 | –3.27 | –9.1 | 0.39 | –3.86 | –7.95 | 6.06 | 2.57 | –6.24 | –2.36 | –8.59 | –11.2 | ||
| MABE | 1.43 | 3.27 | 9.11 | 1.50 | 3.83 | 7.96 | 6.20 | 2.83 | 6.23 | 2.38 | 8.58 | 11.2 | |
| 1.30 | 3.15 | 8.92 | 1.38 | 3.69 | 7.76 | 6.08 | 2.61 | 5.91 | 2.22 | 8.41 | 10.9 | ||
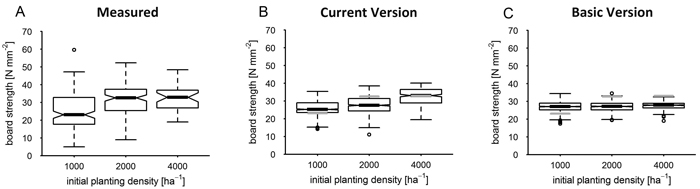
Fig. 6. Board strength by planting density at site Dry after 40 years as measured and as simulated by current and basic version. Grey lines mark the median of measured data; the boxplot notches correspond to the 95% confidence interval (CI) of the median; grey horizontal lines mark the median of measured data in diagrams of simulated result distributions. View larger in new window/tab.
| Table 7. Bias of modelled board strength as CI range of bias (Nmm–1) by planting density (ha–1) at site Dry. | |||||||||||||
| set | variable | mean | median | Q1 | Q3 | ||||||||
| 1000 | 2000 | 4000 | 1000 | 2000 | 4000 | 1000 | 2000 | 4000 | 1000 | 2000 | 4000 | ||
| Dry sim | MBE | 1.45 | –4.77 | –0.35 | 2.21 | –4.84 | 0.43 | 6.1 | –1.56 | 1.55 | –3.9 | –6.23 | –0.51 |
| 1.34 | –4.89 | –0.51 | 1.95 | –5 | 0.23 | 6 | –1.7 | 1.35 | –4.05 | –6.4 | –0.78 | ||
| MABE | 1.54 | 4.89 | 1.08 | 2.53 | 4.99 | 1.3 | 6.1 | 1.86 | 1.98 | 4.03 | 6.39 | 1.3 | |
| 1.41 | 4.74 | 0.98 | 2.31 | 4.85 | 1.16 | 6 | 1.69 | 1.83 | 3.9 | 6.25 | 1.44 | ||
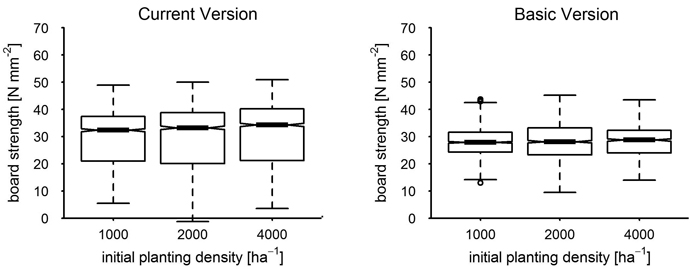
Fig. 7. Board strength by planting density of the current version versus basic version at age 70; the boxplot notches correspond to the 95% confidence interval (CI) of the median.