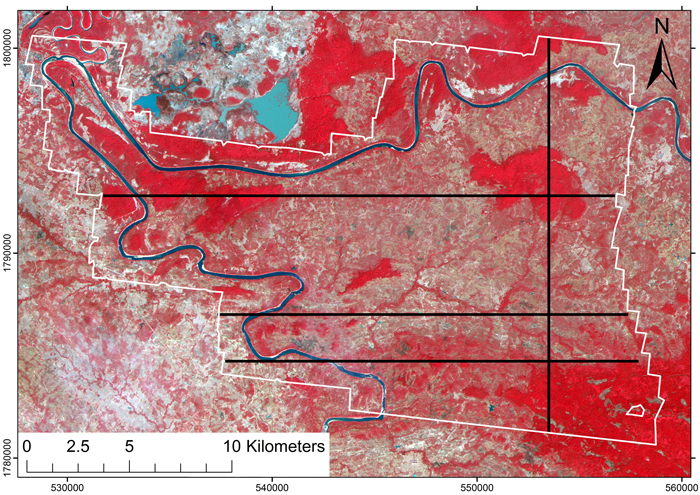
Fig. 1. False-color ALOS AVNIR image of the area. Black transects indicate the location of simulated lidar strips that were used to train the models. The area with lidar coverage is outlined in white.
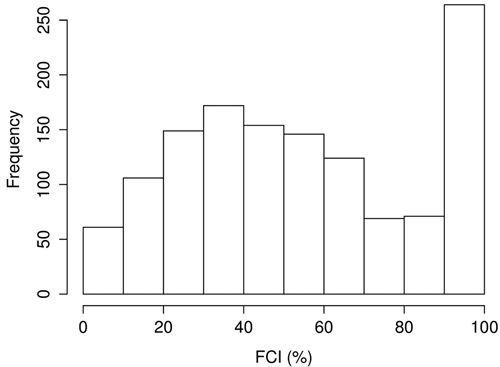
Fig. 2. Histogram of the first echo cover index (FCI) values within our data set.
| Table 1. Zero-and-one inflated beta regression model for the estimation of canopy cover. All coefficients were statistically significant with P < 10–10. The model deviance was –2260.1 and the AIC (Akaike Information Criterion) was –2244.1. | ||||
| Parameter | Link function | Variable | Coefficient | Standard error |
| μ | Logit | Intercept | –48.32 | 3.91 |
| ARVI | 4.139 | 0.202 | ||
| ARVI2 | 1.148 | 0.182 | ||
| BLUE | 0.9399 | 0.0792 | ||
| BLUE2 | –0.004635 | 0.000401 | ||
| σ | Logit | Intercept | –0.9962 | 0.0232 |
| ν | Log | Intercept | –4.678 | 0.290 |
| τ | Log | Intercept | –4.598 | 0.0279 |
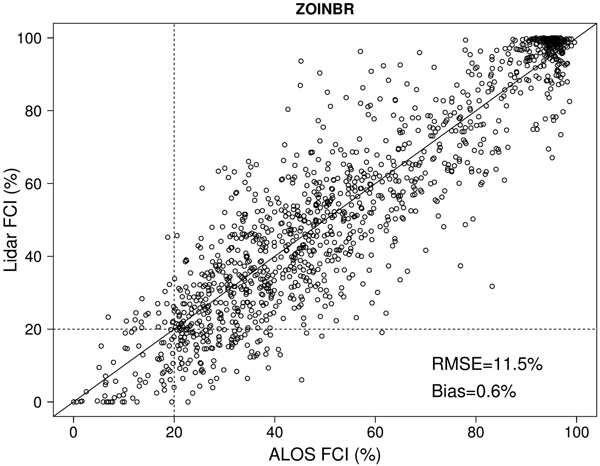
Fig. 3. The relationship between lidar-based canopy cover estimates (FCI) and estimates obtained from the satellite image using zero-and-one inflated beta regression (ZOINBR). Dashed lines show the 20% FCI threshold used in forest/non-forest classification.
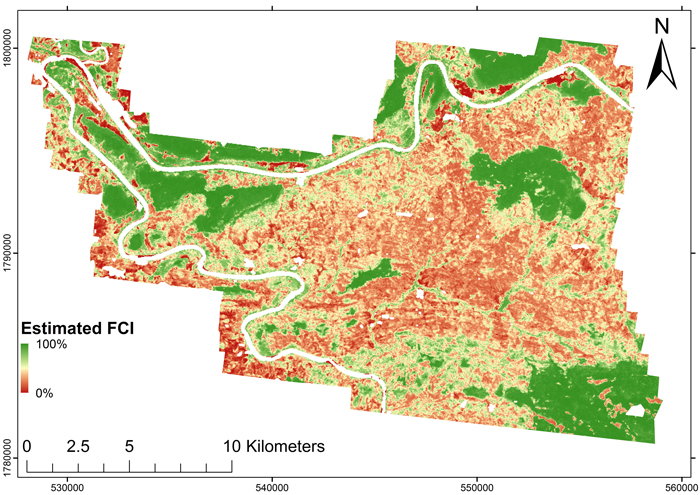
Fig. 4. First echo cover index (FCI) map obtained from the ALOS AVNIR-2 image for the area with lidar coverage.
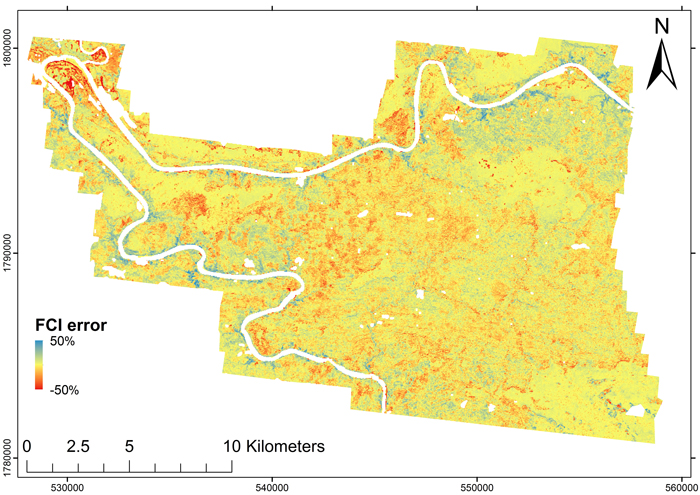
Fig. 5. Error map of the estimated first echo cover index (FCI) obtained from comparison with a lidar-based map. The FCI was underestimated in the blue areas and overestimated in the red areas.
| Table 2. Error matrices of the indirect (ZOINBR) and direct (logistic model) forest/non-forest classification using a 20% FCI threshold in the leave-strip-out cross validation. Kappa coefficients were 0.45 and 0.60 respectively. | |||||
| Observed | User’s accuracy | ||||
| Predicted | Method | Non-forest | Forest | Sum | |
| Non-forest | ZOINBR | 62 | 21 | 83 | 74.7% |
| Logistic model | 110 | 62 | 172 | 64.0% | |
| Forest | ZOINBR | 105 | 1128 | 1233 | 91.5% |
| Logistic model | 57 | 1087 | 1144 | 95.0% | |
| Sum | 167 | 1149 | 1316 | ||
| Producer’s | ZOINBR | 37.1% | 98.2% | 90.4% | |
| Logistic model | 65.9% | 94.6% | 91.0% | ||
| Table 3. Error matrices of the indirect (ZOINBR) and direct (logistic model) forest/non-forest classification using a 20% FCI threshold for the whole population. Kappa coefficients were 0.53 and 0.61 respectively. | |||||
| Observed | User’s accuracy | ||||
| Predicted | Method | Non-forest | Forest | Sum | |
| Non-forest | ZOINBR | 28 500 | 5 645 | 34 145 | 83.5% |
| Logistic model | 37 330 | 12 171 | 49 501 | 75.4% | |
| Forest | ZOINBR | 35 095 | 339 977 | 375 072 | 90.6% |
| Logistic model | 26 265 | 333 451 | 359 716 | 92.7% | |
| Sum | 63 595 | 345 622 | 409 217 | ||
| Producer’s | ZOINBR | 44.8% | 98.3% | 90.0% | |
| Logistic model | 58.7% | 96.5% | 90.6% | ||
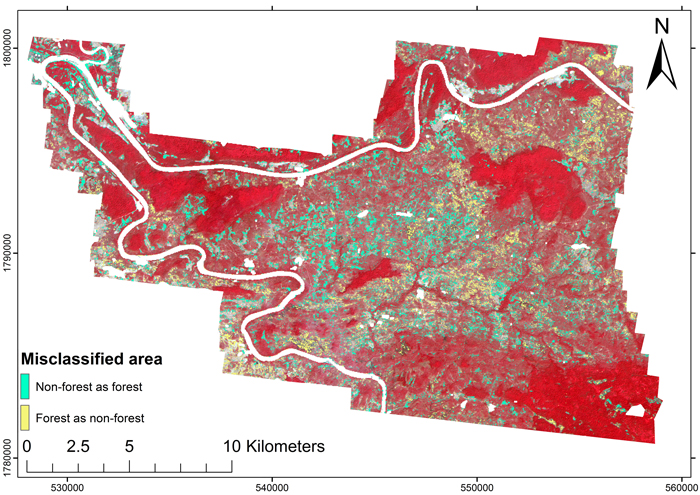
Fig. 6. Error map of the forest/non-forest classification using the logistic model (Eq. 11).
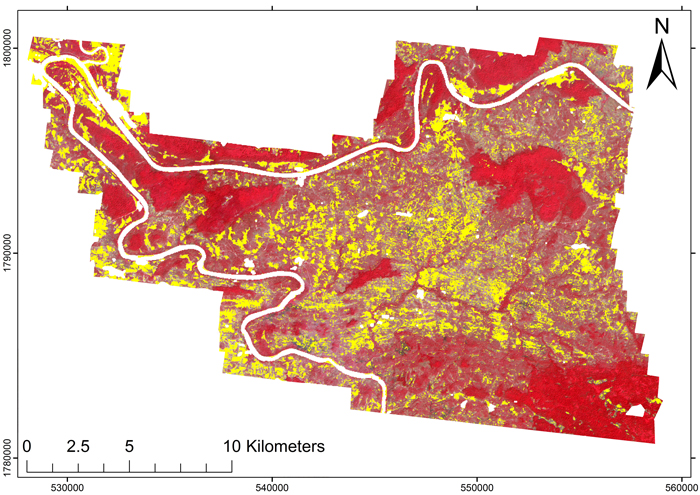
Fig. 7. Lidar-based map of the non-forest areas (yellow). Based on the lidar, 84.5% of the scanned area was forest, based on the 20% FCI criterion. Also, the areas between the indigenous mixed deciduous forests frequently had an FCI > 20%.
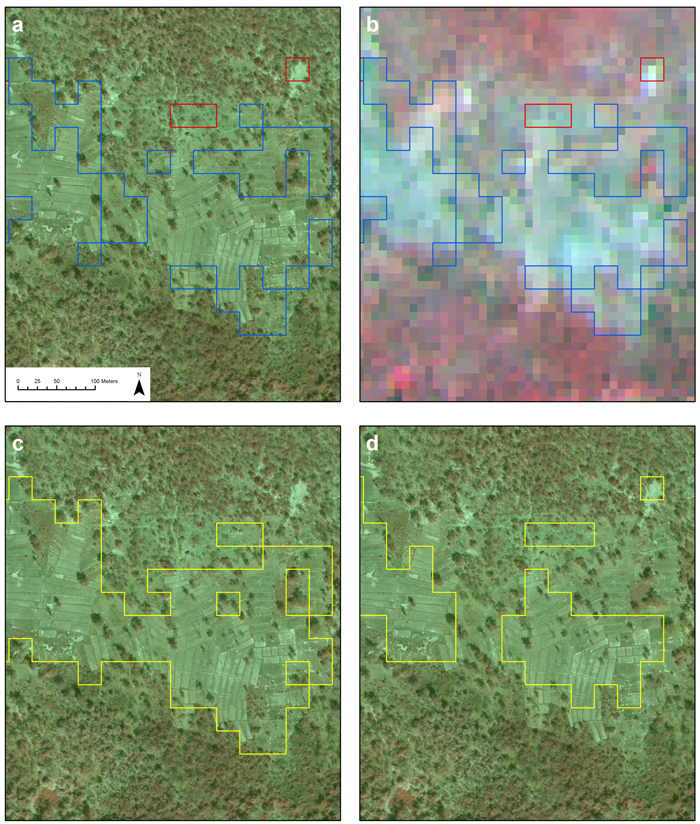
Fig. 8. Typical site with classification errors. Panel a) shows the classification errors visualized in an aerial image, and b) in the ALOS AVNIR-2 satellite image. Blue polygons are non-forest areas classified as forest, red polygons forest areas classified as non-forest. Below, c) shows the extent of the lidar-based non-forest area, and d) its ALOS-based estimate upon the aerial image. View larger in new window/tab.