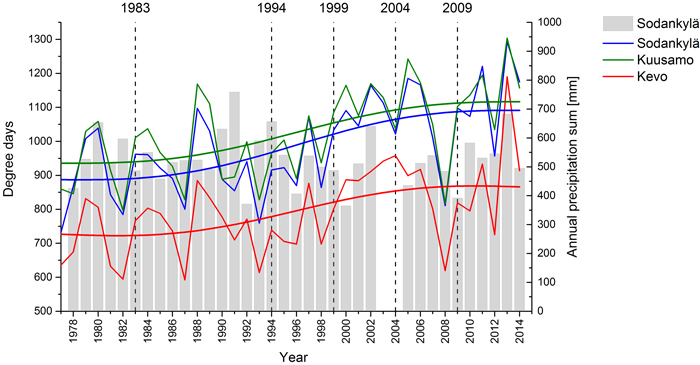
Fig. 1. Effective temperature sums (+4 °C threshold) in Kuusamo, Sodankylä and Kevo and annual precipitation sums (columns) in Sodankylä from 1977 to 2013. The climate datasets (thin lines, columns) are provided in a yearly resolution by European Climate Assessment & Dataset (Klein Tank et al. 2002) and smoothed by using a Fast Fourier Transformation (thick lines).
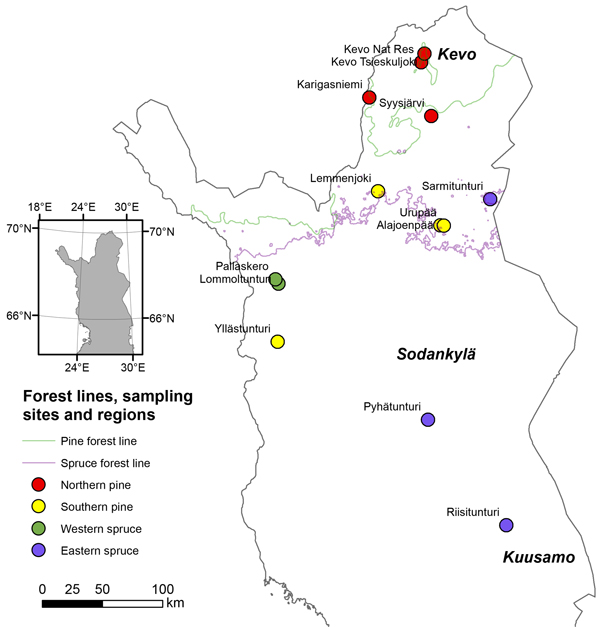
Fig. 2. Monitoring locations of spruce and pine in Finnish Lapland as well as the forest lines of both species. The locations were divided on the basis of predominant species and geographical areas into a northern and southern region of pine and into a western and eastern region of spruce.
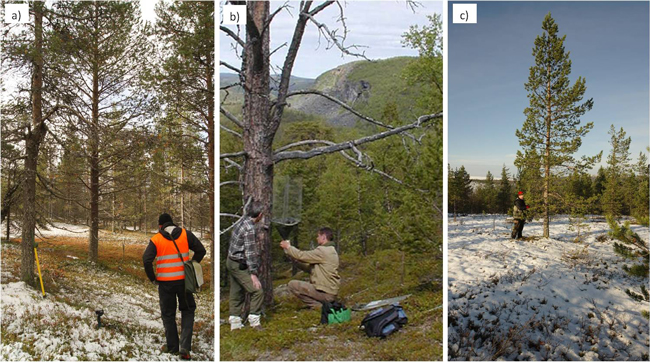
Fig. 3. Examples of the forest stands in the a) forest zone (Yllästunturi), b) timber-line zone (Kevo) and c) tree-line zone (Urupää) (Photos by Seppo Neuvonen and Anna Franke).
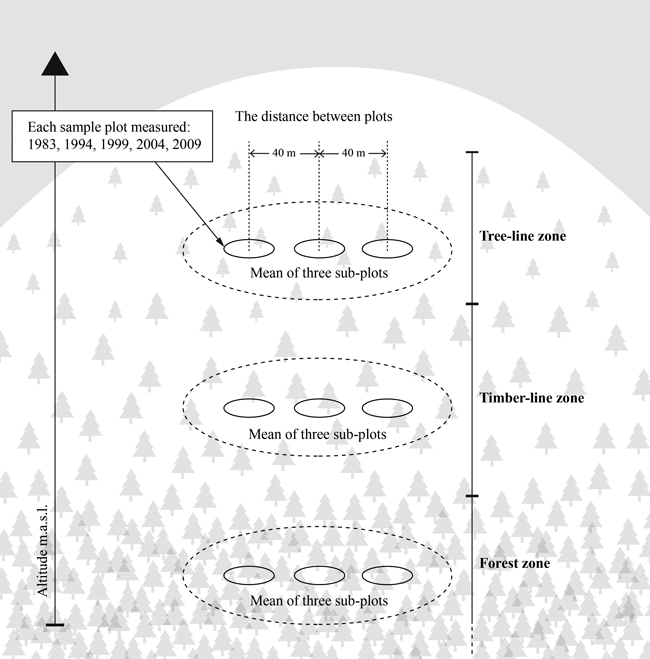
Fig. 4. Sampling design in each of the 13 locations. The sampling was done on three sample plots in forest and timber- and tree-line zones in 1983, 1994, 1999, 2004 and 2009.
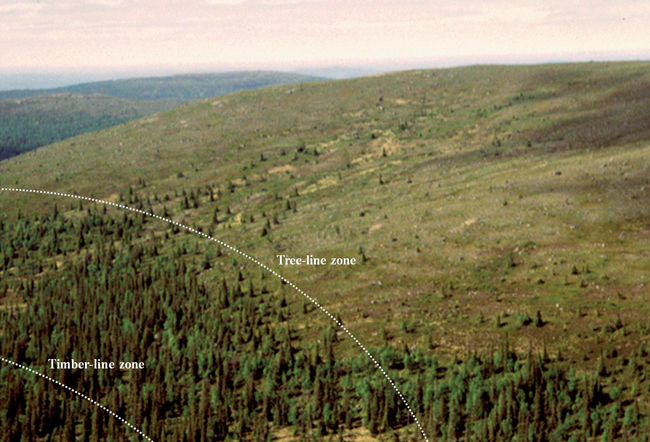
Fig. 5. Example of a sampling location (Sarmitunturi) showing the position of the timber-line and tree-line zones (Photo by Raimo Sutinen). The forest zone is located further downhill and therefore not shown in the photo.
| Table 1. Coordinates, altitude, temperature sum, and horizontal distance between the zones in each location. Coordinates and temperature sums are focused on the timber-line zones. The average temperature sums (+5 °C threshold) were provided in a climatic grid (1961–90 standard period) by using the model of Ojansuu and Henttonen (1983). | |||||||||
| Altitude (m a.s.l.) | Horizontal distance (m) between | ||||||||
| Location | Latitude | Longitude | Dominant conifer1 | Forest zone | Timber line | Tree line | Temperature sum (d.d. 5 °C) | Forest and timber line | Timber line and tree line |
| Kevo Tsieskuljoki | 69°41’ N | 26°59’ E | P | 110 | 180 | 190 | 773 | 310 | 180 |
| Kevo, nat. res | 69°45’ N | 27°03’ E | P | 185 | 210 | 225 | 741 | 230 | 100 |
| Karigasniemi | 69°25’ N | 25°53’ E | P | 225 | 275 | 420 | 770 | 840 | 810 |
| Syysjärvi | 69°17’ N | 27°12’ E | P | 215 | 220 | 225 | 781 | 1280 | 11460 |
| Lemmenjoki | 68°43’ N | 26°06’ E | P | 285 | 375 | 415* | 782 | 460 | 130 |
| Urupää | 68°28’ N | 27°26’ E | P | 315 | 340 | 370* | 745 | 140 | 210 |
| Alajoenpää | 68°28’ N | 27°22’ E | P | 340 | 380 | 400* | 748 | 250 | 270 |
| Ylläs | 67°34’ N | 24°11’ E | P | 380 | 410 | 465* | 900 | 240 | 210 |
| Lommoltunturi | 68°00’ N | 24°09’ E | S | 410 | 445 | 465* | 874 | 250 | 120 |
| Pallaskero | 68°02’ N | 24°06’ E | S | 465 | 480 | 500* | 892 | 220 | 110 |
| Sarmitunturi | 68°39’ N | 28°23’ E | S | 340 | 370 | 410* | 842 | 150 | 160 |
| Pyhätunturi | 67°01’ N | 27°07’ E | S | 380 | 400 | 420 | 914 | 300 | 260 |
| Riisitunturi | 66°13’ N | 28°33’ E | S | 420 | 440 | 460* | 943 | 120 | 190 |
| 1 Dominant conifer species: P = pine, S = spruce. * Indicates that a larger sample plot area (500 m2) has been used. | |||||||||
| Table 2. The estimates and Likelihood-ratio tests of the models for Norway spruce, t-values for the coefficients and χ2 – values for the Likelihood ratio tests are presented in t/Chisq. Tests show the significance of the variables in the model and the significance of the coefficients related to the reference categories (given in parentheses). A non-significant interaction term means that the coefficients do not differ from the coefficient of reference category. | ||||||
| Variable / term | Coefficient | Std. error | Df | t/Chisq | p | |
| Norway spruce, number of trees and seedlings ha–1 | ||||||
| Intercept | 7.000 | 0.376 | 56/1 | 18.62/346.54 | 0.000 | |
| Region (ref. Western) | 1 | 4.28 | 0.039 | |||
| -Eastern | -0.854 | 0.412 | 3 | -2.07 | 0.130 | |
| Zone (ref. Forest) | 2 | 3.70 | 0.157 | |||
| -Timber line | 0.333 | 0.342 | 8 | 0.97 | 0.359 | |
| -Tree line | -0.325 | 0.342 | 8 | -0.95 | 0.370 | |
| Time | 0.018 | 0.010 | 56/1 | 1.77/3.13 | 0.077 | |
| Region*Time | 1 | 1.81 | 0.179 | |||
| -Eastern*Time | -0.013 | 0.010 | 56 | -1.35 | 0.184 | |
| Zone*Time | 2 | 3.49 | 0.175 | |||
| -Timber line*Time | 0.006 | 0.012 | 56 | 0.48 | 0.630 | |
| -Tree line*Time | 0.021 | 0.012 | 56 | 1.80 | 0.077 | |
| Random effects | Estimate | Cl 95% | ||||
| Location | 0.107 | 0.007 – 1.682 | ||||
| Zone nested Location | 0.187 | 0.061 – 0.579 | ||||
| Error (compound symmetry) | 0.141 | 0.098 – 0.205 | ||||
| Norway spruce, volume of tree stock, m3ha–1 | ||||||
| Intercept | 7.970 | 1.073 | 56/1 | 7.43/55.19 | 0.000 | |
| Region (ref. Western) | 1 | 0.65 | 0.420 | |||
| -Eastern | -1.031 | 1.278 | 3 | -0.81 | 0.479 | |
| Zone (ref. Forest) | 2 | 67.50 | 0.000 | |||
| -Timber line | -2.056 | 0.717 | 8 | -2.87 | 0.021 | |
| -Tree line | -5.812 | 0.717 | 8 | -8.10 | 0.000 | |
| Time | 0.043 | 0.010 | 56/1 | 4.27/18.21 | 0.000 | |
| Region*Time | 1 | 2.85 | 0.091 | |||
| -Eastern*Time | -0.017 | 0.010 | 56 | -1.69 | 0.097 | |
| Zone*Time | 2 | 8.10 | 0.017 | |||
| -Timber line*Time | 0.012 | 0.012 | 56 | 1.04 | 0.301 | |
| -Tree line*Time | -0.021 | 0.012 | 56 | -1.77 | 0.082 | |
| Random effects | Estimate | Cl 95% | ||||
| Location | 1.530 | 0.197 – 11.853 | ||||
| Zone nested within Location | 1.186 | 0.443 – 3.177 | ||||
| Error (ARH-1, phi = 0.55) | 0.398 | 0.165 – 0.957 | ||||
| Table 3. The estimates and Likelihood-ratio tests of the models for Scots pine, t-values for the coefficients and χ2 – values for the Likelihood ratio tests are presented in t/Chisq. Tests show the significance of the variables in the model and the significance of the coefficients related to the reference categories (given in parentheses). A non-significant interaction term means that the coefficients do not differ from the coefficient of reference category. | ||||||
| Variable / term | Coefficient | Std. error | Df | t/Chisq | p | |
| Scots pine, number of trees and seedlings ha–1 | ||||||
| Intercept | 6.577 | 0.695 | 90/1 | 9.43/88.90 | 0.000 | |
| Region (ref. Northern) | 1 | 0.84 | 0.359 | |||
| -Southern | 0.729 | 0.795 | 6 | 0.92 | 0.395 | |
| Zone (ref. Forest) | 2 | 10.12 | 0.006 | |||
| -Timber line | -1.040 | 0.710 | 14 | -1.47 | 0.165 | |
| -Tree line | -2.256 | 0.710 | 14 | -3.18 | 0.007 | |
| Time | 0.012 | 0.009 | 90/1 | 1.36/1.85 | 0.174 | |
| Region*Time | 1 | 12.95 | 0.000 | |||
| -Southern*Time | -0.032 | 0.009 | 90 | -3.60 | 0.001 | |
| Zone*Time | 2 | 0.91 | 0.635 | |||
| -Timber line*Time | -0.010 | 0.011 | 90 | -0.89 | 0.377 | |
| -Tree line*Time | -0.008 | 0.011 | 90 | -0.74 | 0.464 | |
| Random effects | Estimate | Cl 95% | ||||
| Location | 0.591 | 0.050 – 7.018 | ||||
| Zone nested Location | 1.876 | 0.882 – 3.990 | ||||
| Error (compound symmetry) | 0.185 | 0.138 – 0.248 | ||||
| Scots pine, volume of tree stock, m3ha–1 | ||||||
| Intercept | 7.124 | 1.166 | 90/1 | 6.11/37.34 | 0.000 | |
| Region (ref. Northern) | 1 | 0.00 | 0.997 | |||
| -Southern | -0.005 | 1.296 | 6 | -0.00 | 0.997 | |
| Zone (ref. Forest) | 2 | 24.57 | 0.000 | |||
| -Timber line | -3.665 | 1.247 | 14 | -2.94 | 0.011 | |
| -Tree line | -6.145 | 1.247 | 14 | -4.93 | 0.000 | |
| Time | 0.054 | 0.015 | 90/1 | 3.64/13.27 | 0.000 | |
| Region*Time | 1 | 0.50 | 0.478 | |||
| -Southern*Time | -0.011 | 0.015 | 90 | -0.71 | 0.479 | |
| Zone*Time | 2 | 5.47 | 0.065 | |||
| -Timber line*Time | 0.026 | 0.018 | 90 | 1.43 | 0.155 | |
| -Tree line*Time | -0.016 | 0.018 | 90 | -0.89 | 0.377 | |
| Random effects | Estimate | Cl 95% | ||||
| Location | 1.287 | 0.084 – 19.753 | ||||
| Zone nested within Location | 4.968 | 2.348 – 10.513 | ||||
| Error (ARH-1, phi = 0.91) | 1.325 | 0.533 – 3.294 | ||||
| Table 4. Significances (p-values) of asymptotical tests for the coefficients of the interaction terms (Time*Region or Time*Zone) in the models. Hypothesis is that the coefficients = 0. The arrows denote either a significant increasing or decreasing change in time, or non-significant change (flat arrow). | ||||
| Coefficient | Scots pine, number of trees ha–1 | Scots pine, volume of tree stock, m3ha–1 | Norway spruce, number of trees ha–1 | Norway spruce, volume of tree stock, m3ha–1 |
| Region: northern (pine), western (spruce) | 0.327 → | 0.000 ↗ | 0.000 ↗ | 0.000 ↗ |
| Region: southern (pine), eastern (spruce) | 0.000 ↘ | 0.000 ↗ | 0.026 ↗ | 0.000 ↗ |
| Zone: forest | 0.590 → | 0.000 ↗ | 0.127 → | 0.000 ↗ |
| Zone: timber line | 0.078 → | 0.000 ↗ | 0.041 ↗ | 0.000 ↗ |
| Zone: tree line | 0.120 → | 0.011 ↗ | 0.000 ↗ | 0.086 → |
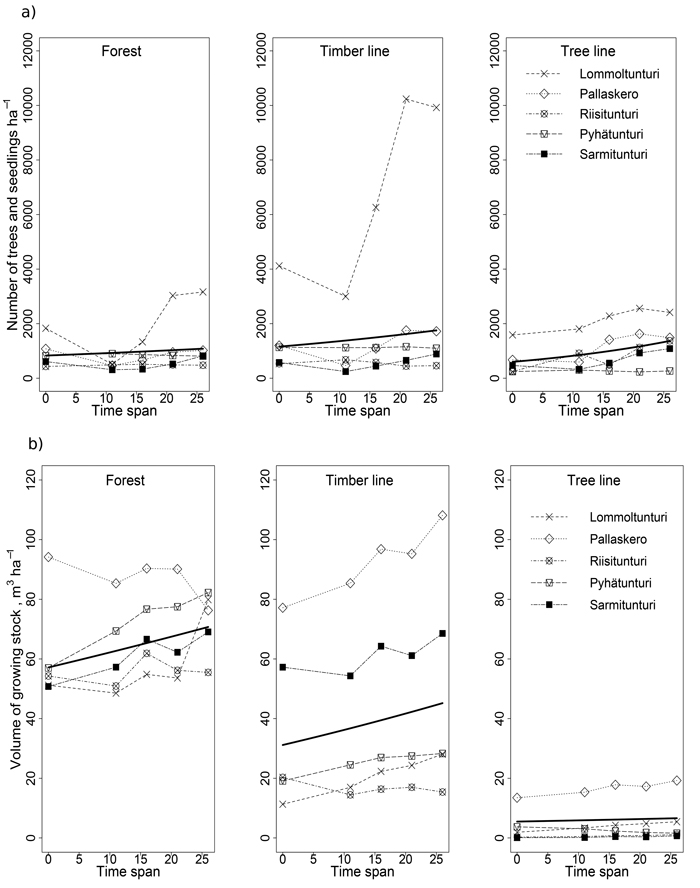
Fig. 6. The stem number ha–1 (a) and volume of growing stock m3 ha–1 (b) of spruce during the study in each location (raw data) as well as the predicted values of the models for each zone (thick line).
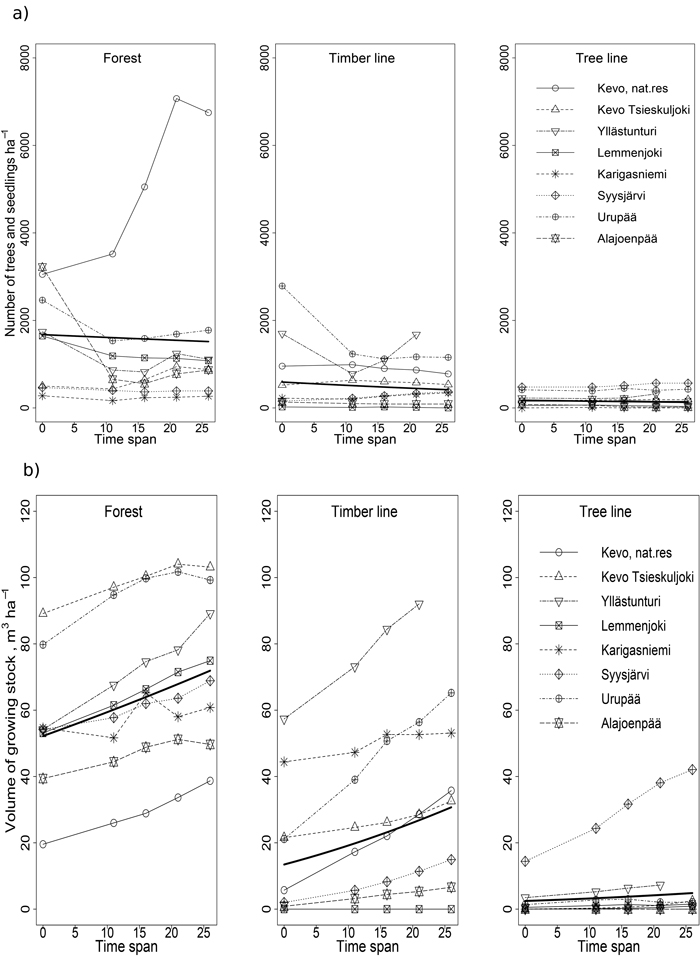
Fig. 7. The stem number ha–1 (a) and volume of growing stock m3 ha–1 (b) of pine during the study in each location (raw data) as well as the predicted values of the models for each zone (thick line).