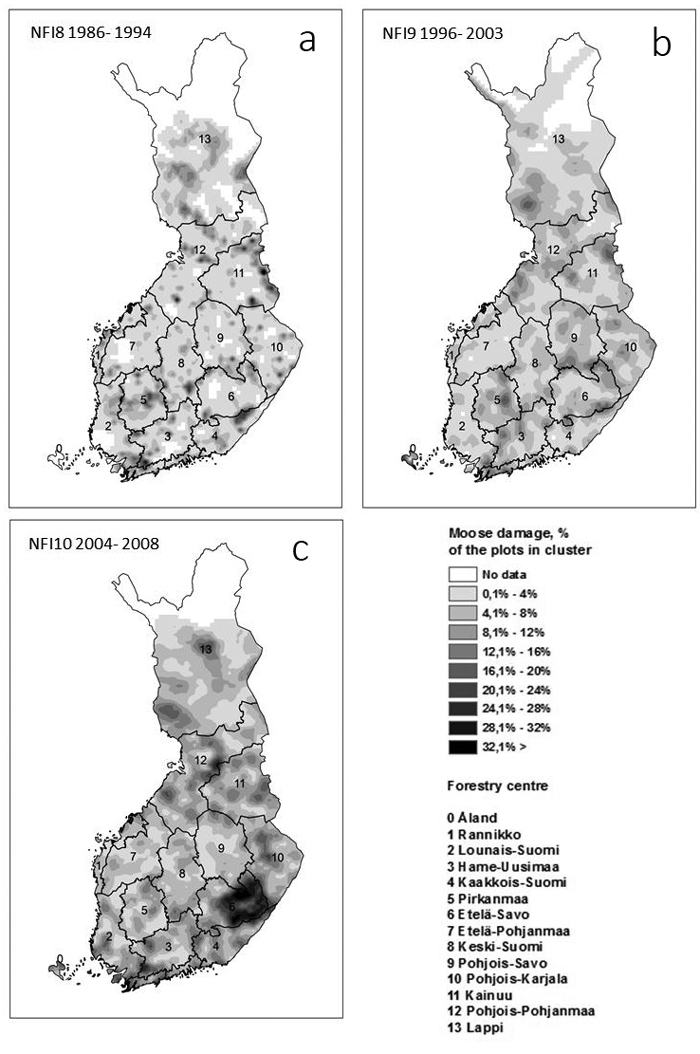
Fig. 1. The geographical distribution of moose damage in young stands (development classes 2–4) in the three National Forest inventories (NFIs). The approximate borders of the inventory areas as well inventory years of the 8th and 9th NFI are shown in a) and b). The borders of the former Forest Centers are shown in c). The map was produced from tractwise means of moose damaged plots by kriging (spherical model)in ArcGis. The output cell size was 10 km.
| Table 1. Description of the most relevant stand variables and description of the variables used for assessing forest damage at the stand level in the 8th–10th National Forest Inventories (NFI) of Finland 1986–2004. The numbers (8,9,0) after the damage codes refer to the NFIs (10th NFI expressed as 0). For a more detailed description, see Tomppo et al. 2011. View in new window/tab. |
| Table 2. The occurrence of different standwise damage degree classes of moose damage in forest land in Finland in three National Forest Inventories, split by the main tree species and the development class of the stand. The numbers present the estimated area in km2. View in new window/tab. |
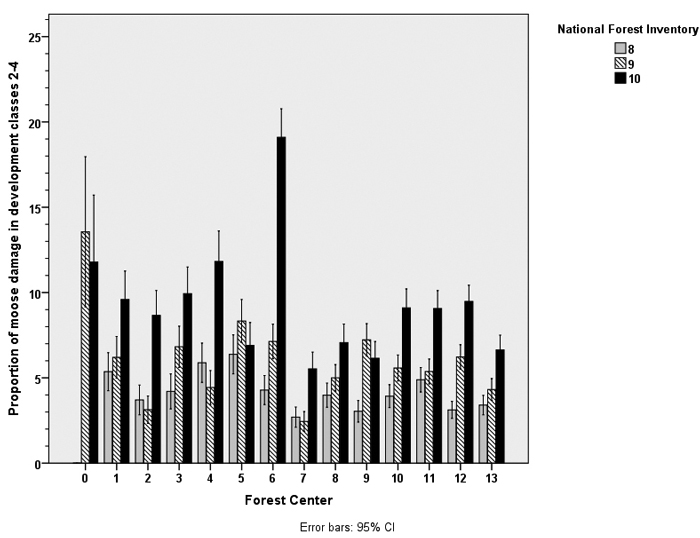
Fig. 2. The proportion of moose damage in young stands (development classes 2–4) in the area of Forest Centers in Finland. The borders of the Forest Centers are shown in Fig. 1.
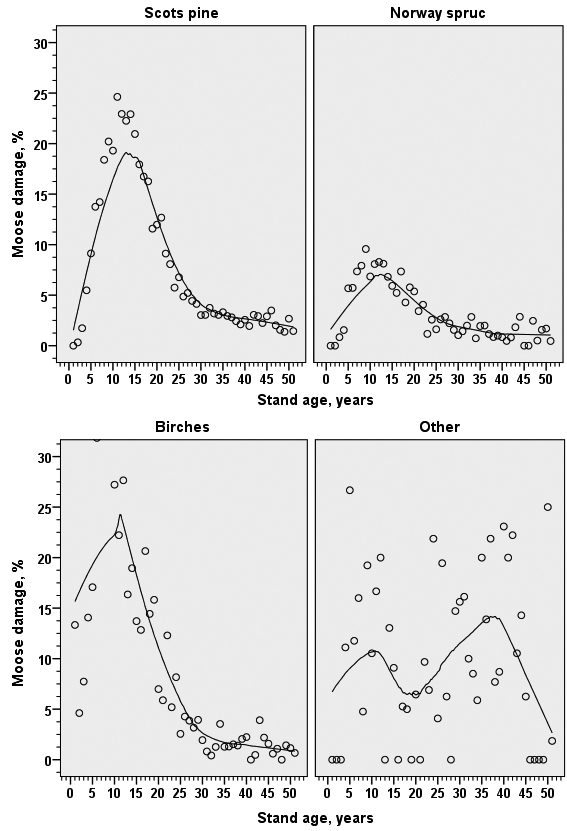
Fig. 3. The proportion of moose damage in young stands (development classes 2–4) related to stand age in stands dominated by different tree species. The line in produced with Loess-smoothing algorithm in IBM SPSS Statistics.
| Table 3. The proportion of moose damage in young stands (development classes 2–4) by main tree species and mixed species in the stand. Data: combined data of NFI8–NFI10 (1986–2008). N = number of plots, s.d. = standard deviation. | ||||
| Main tree species | Mixed species | Proportion of moose damage | N | s.d. |
| Scots pine | None | .0497 | 34795 | .217 |
| Norway spruce | .1054 | 10709 | .307 | |
| Birches | .0696 | 19926 | .254 | |
| Aspen | .1287 | 171 | .336 | |
| Alders | .0545 | 110 | .228 | |
| Rowan | .0769 | 13 | .277 | |
| Other | .0677 | 1581 | .251 | |
| Total | .0651 | 67305 | .247 | |
| Norway spruce | None | .0059 | 5726 | .077 |
| Scots pine | .0838 | 3698 | .277 | |
| Birches | .0238 | 7059 | .152 | |
| Aspen | .0645 | 248 | .246 | |
| Alders | .0071 | 421 | .084 | |
| Rowan | .0769 | 13 | .277 | |
| Other | .0198 | 605 | .140 | |
| Total | .0306 | 17770 | .172 | |
| Birches | None | .0893 | 3393 | .285 |
| Scots pine | .0618 | 3705 | .241 | |
| Norway spruce | .0640 | 2967 | .245 | |
| Aspen | .1240 | 242 | .330 | |
| Alders | .0261 | 230 | .160 | |
| Rowan | .1176 | 17 | .332 | |
| Other | .0407 | 491 | .198 | |
| Total | .0706 | 11045 | .256 | |
| Aspen | None | .1429 | 28 | .356 |
| Scots pine | .2963 | 54 | .461 | |
| Norway spruce | .2551 | 98 | .438 | |
| Birches | .3357 | 143 | .474 | |
| Alders | .1538 | 13 | .376 | |
| Rowan | .0000 | 2 | .000 | |
| Other | .1944 | 36 | .401 | |
| Total | .2727 | 374 | .446 | |
| Alders | None | .0082 | 122 | .091 |
| Scots pine | .0000 | 55 | .000 | |
| Norway spruce | .0000 | 107 | .000 | |
| Birches | .0222 | 180 | .148 | |
| Aspen | .0000 | 17 | .000 | |
| Rowan | .0000 | 15 | .000 | |
| Other | .0270 | 111 | .163 | |
| Total | .0132 | 607 | .114 | |
| Rowan | None | .0000 | 16 | .000 |
| Scots pine | .3333 | 3 | .577 | |
| Norway spruce | .0000 | 3 | .000 | |
| Birches | .2174 | 23 | .422 | |
| Aspen | .3333 | 3 | .577 | |
| Alders | .1667 | 6 | .408 | |
| Other | .1000 | 10 | .316 | |
| Total | .1406 | 64 | .350 | |
| Other | None | .0323 | 62 | .178 |
| Scots pine | .0909 | 44 | .291 | |
| Norway spruce | .0625 | 48 | .245 | |
| Birches | .0441 | 68 | .207 | |
| Alders | .0000 | 3 | .000 | |
| Total | .0533 | 225 | .225 | |
| All stands | None | .0469 | 44142 | .212 |
| Scots pine | .0741 | 7559 | .262 | |
| Norway spruce | .0967 | 13932 | .296 | |
| Birches | .0589 | 27399 | .236 | |
| Aspen | .1013 | 681 | .302 | |
| Alders | .0230 | 783 | .150 | |
| Rowan | .0667 | 60 | .252 | |
| Other | .0529 | 2834 | .224 | |
| Total | .0599 | 97390 | .237 | |
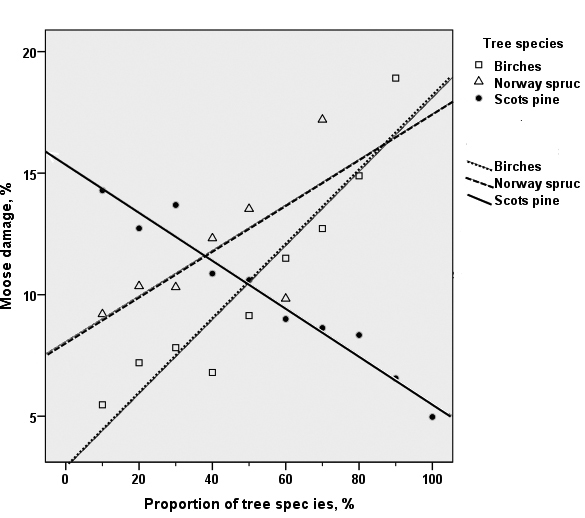
Fig. 4. The relationships between the proportion of moose damage and the proportion of tree species in young Scots pine dominated stands (development classes 2–4) in the combined data of the 8th–10th National Forest Inventories. The black dots and the solid line show the proportion of Scots pine. The open squares and the dashed line show the proportion of birch species, the open triangles and the dotted line show the proportion of Norway spruce (in Scots pine dominated stands).
| Table 4. The occurrence of moose damage in relation to main site type (mineral soil/peatland, proposed thinning operation, accomplished soil preparation or artificial regeneration, according to the GLMM-model and raw data. Data: Stands in development classes 2–4. NFI8–NFI10, all tree species. The moose damage in the model columns were averaged over the levels of class variables, and the continuous variables were fixed in their mean values (for the variables, see Table 6). In the data columns, the p-value is based on the Fishers’s exact test. The odds ratios are also shown. The values in the data columns were computed from the actual plot numbers in a 2 × 2 table. | ||||||
| Variable | Value | Model | Data | |||
| Probalility of damage | p-value | Proportion of damage | p-value | Odds ratio | ||
| Peatland plot | No | 5.15 | <.0001 | 7.00 | <.0001 | 0.505 |
| Yes | 4.09 | 3.67 | ||||
| Thinning or clearing proposed | No | 3.77 | <.0001 | 4.04 | <.0001 | 3.386 |
| Yes | 5.58 | 12.47 | ||||
| Soil preparation accomblished | No | 4.17 | <.0001 | 4.69 | <.0001 | 3.273 |
| Yes | 5.07 | 13.87 | ||||
| Artificial regeration | No | 4.09 | <.0001 | 4.26 | <.0001 | 2.094 |
| Yes | 5.16 | 8,52 | ||||
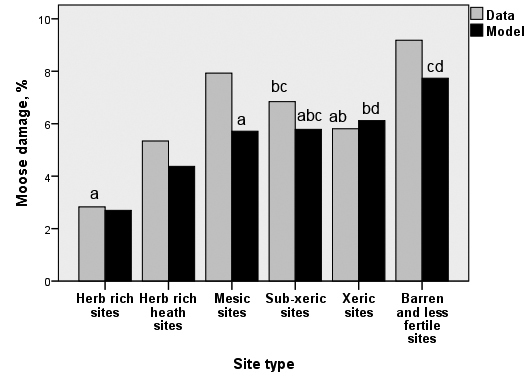
Fig. 5. The proportion of moose damage in raw data (column “Data”) and the predicted probability of damage by the GLMM model (column “Model”), by site types of the stand in mineral soils. Data: development classes 2–4 in the combined data of the 8th–10th National Forest Inventories. The moose damage in the model columns were averaged over the levels of class variables, and the continuous variables were fixed in their mean values (for the variables, see Table 6). The bars marked with the same letter (bar groups treated separately) do not differ in pairwise comparisons (95% confidence level).
| Table 5. Classification table (observed vs. predicted number of plots with or without moose damage). Model: generalized mixed linear (GLMM) model, estimated for the presence/absense of moose damage with the glmer function in lme4-package in R. Various measures for the success of the classification are also given. Data: NFI8–NFI10 (1986–2008), development classes 2–4. | |||
| Predicted | |||
| No | Yes | ||
| Observed | No | 70467 | 21087 |
| Yes | 543 | 5291 | |
| Sensitivity | 0.907 | ||
| Specificity | 0.770 | ||
| Correct classification rate | 0.778 | ||
| False positive | 0.230 | ||
| False negative | 0.093 | ||
| Positive predictive value | 0.200 | ||
| Negative predictive value | 0.992 | ||
| Area under the curve (AUC) | 0.920 | ||
| Table 6. Results of the generalized mixed linear model (GLMM), estimated for the presence/absense of moose damage with the glmer function in lme4-package in R. The fixed effects of the explanatory variables are shown. Data: NFI8– NFI10 (1986–2008), development classes 2–4, total N = 93390. | ||||
| Variable | Estimate | Std. Error | z-value | p-value |
| (Intercept) | –3.213e+00 | 1.979e–01 | –15.020 | < 0.001 |
| Stand mean age (years) | –1.832e–02 | 1.950e–03 | –9.394 | < 0.001 |
| Site type 2 1) | 5.017e–01 | 1.417e–01 | 3.539 | < 0.001 |
| Site type 3 1) | 7.831e–01 | 1.419e–01 | 5.519 | < 0.001 |
| Site type 4 1) | 7.960e–01 | 1.462e–01 | 5.443 | < 0.001 |
| Site type 5 1) | 8.556e–01 | 1.591e–01 | 5.378 | < 0.001 |
| Site type 6 1) | 1.108e+00 | 2.051e–01 | 5.401 | < 0.001 |
| Elevation of the plot (m) | 3.927e–04 | 2.954e–05 | 13.297 | < 0.001 |
| Stand basal area (m2/ha) | –9.158e–02 | 3.711e–03 | –24.680 | < 0.001 |
| Peatland (0/1) | –2.411e–01 | 6.045e–02 | –3.988 | < 0.001 |
| Thinning proposed (0/1) | 4.099e–01 | 3.620e–02 | 11.322 | < 0.001 |
| Artificial regeneration (0/1) | 2.427e–01 | 3.970e–02 | 6.114 | < 0.001 |
| Soil preparation accompished (0/1) | 2.053e–01 | 4.066e–02 | 5.048 | < 0.001 |
| Main tree species Norway spruce 2) | –1.224e+00 | 6.059e–02 | –20.203 | < 0.001 |
| Main tree species birches 2) | 1.597e–01 | 6.364e–02 | 2.510 | 0.012 |
| Main tree species aspen 2) | 2.848e+00 | 1.530e–01 | 18.613 | < 0.001 |
| Main tree species alder 2) | –8.108e–01 | 3.808e–01 | –2.129 | 0.033 |
| Main tree species rowan 2) | 3.891e–01 | 4.163e–01 | 0.935 | 0.349 |
| Main tree species other 2) | –8.537e–01 | 3.290e–01 | –2.594 | 0.009 |
| Mixed tree species Scots pine 3) | 3.881e–01 | 7.951e–02 | 4.881 | < 0.001 |
| Mixed tree species Norway spruce 3) | 4.332e–01 | 4.615e–02 | 9.387 | < 0.001 |
| Mixed tree species birches 3) | 2.648e–01 | 3.981e–02 | 6.651 | < 0.001 |
| Mixed tree species aspen 3) | 1.724e+00 | 1.533e–01 | 11.244 | < 0.001 |
| Mixed tree species alder 3) | –9.798e–02 | 2.624e–01 | –0.373 | 0.708 |
| Mixed tree species rowan 3) | –4.107e–01 | 5.885e–01 | –0.698 | 0.485 |
| Mixed tree species other 3) | 1.345e–01 | 1.034e–01 | 1.301 | 0.193 |
| 1) Compared with the most fertile site type 1 2) Compared with s stands with Scots pine as the main tree species 3) Compared with s stands without any mixed species | ||||