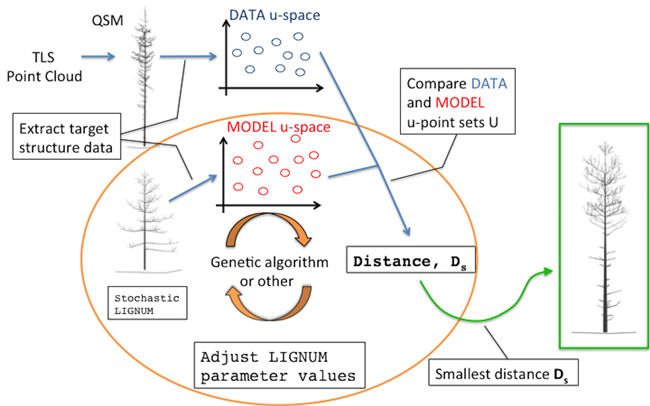
Fig. 1. An overall diagram of the fundamental components of the procedure. The main novelty of this study comprises the orange circle depicting the iterative optimization procedure fitting LIGNUM structural data to those of the field-data Quantitative Structural Model (QSM) that was obtained from the Terrestrial Laser Scanning (TLS) point cloud.
| Table 1. The LIGNUM parameters used in this study. Parameters fixed during simulations are reported; the varied (-) and not used (NA) parameters are omitted. Other parameters are from Perttunen et al. (1998) for the synthetic simulation (Section 3.1) and Sievänen et al. (2008) for the real case study (Section 3.2). | |||
| Parameter | Description | Synthetic | Real |
| R | full exposure radiation for a tree segment, relative | 30.0 | 60.0 |
| Smax | maximum shadow induced by a tree segment, relative | 10.0 | - |
| SL | shadow propagation distance, [m] | 0.55 | - |
| VS | linear voxel size, [m] | 0.02 | 0.02 |
| Renv | radius of the circular boundary around the tree stem that the branches are not allowed to cross, [m] | 1.33 | - |
| LR | ratio between the radius and length of a tree segment, dimensionless | - | - |
| Q | apical dominance parameter, varied between 0 (no dominance) and 1 (maximum dominance), dimensionless | - | - |
| βinit , βmax | initial and maximal inclination angles, respectively: angles between the first branch segment and the segment it emanates from, [degree] | - , 95 | - |
| ∆β | inclination angle increment, [degree] | - | - |
| ∆ζ, ∆γ | intensity of the white noise added to the vertical (∆ζ) and horizontal (∆γ) orientations of the segments, [degree] | - , 5 | - |
| T | number of iterations/years of simulation | - | - |
| Tsh | when shedding a branch, the lower age limit for the branch segments | NA | - |
| μsh | parameter to the Poisson variable determining number of the tip segments to shed | NA | - |
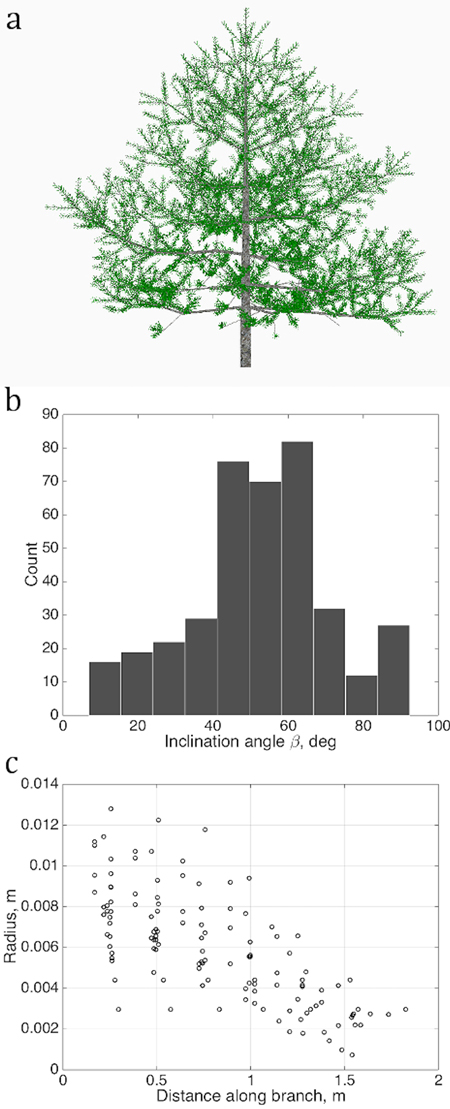
Fig. 2. Sets of points describing the stochastic structure of a tree: a) the simulated LIGNUM tree, source for the data sets; b) the branching/inclination angles of all branches of the 2nd order, (1D set) and c) 1st order tapering, the local cross-section area radius of a branch against the distance from the base of the branch, gathered from all branches of order 1 (2D set). Order is the Gravelius order of a tree such that the lowest order (tree stem) equals to zero.
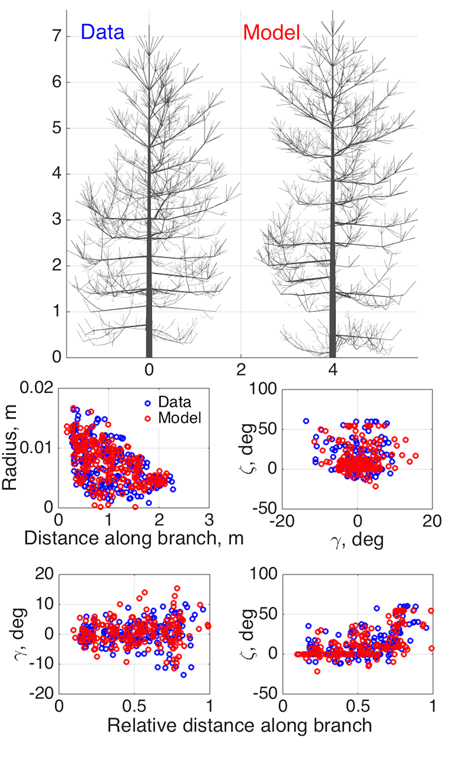
Fig. 3. Model SSM tree shape fitting the emulated QSM “data”, using 8-parameter estimation. Two datasets were used in optimization: 1st order tapering (see also Fig. 2) and spatial curvature, described with two spatial angles (in the horizontal (γ) and vertical (ζ) planes) between consecutive segments as functions of the relative length along branch. The 2D projections of the datasets for the data and the optimized tree are shown in the lower panel.
| Table 2. Parameter estimation in the emulated “data” case. The tree shapes and fitted structural data sets are shown in Fig. 3. Parameters LR and Q follow the normal distribution having two parameters: mean and standard deviation (std). Other LIGNUM parameters are from Perttunen et al. (1998) and R = 30.0, Smax = 10.0, SL = 0.55 m, VS= 0.02 m, Renv = 1.33 m, βmax = 95 degree, ∆γ = 5 degree, and original shedding options (Sievänen et al. 2008). See Table 1 for the parameter definitions. The genetic algorithm has stopped after 22 full iterations/generations, each generation consisted of 40 parameter sets. | |||
| Parameter name | Data value | Model value (estimated) | Relative error, % |
| LR, mean | 0.009 | 0.0094 | 4.65 |
| LR, std | 0.001 | 0.0009 | 6.95 |
| Q, mean | 0.2 | 0.2058 | 2.88 |
| Q, std | 0.03 | 0.0213 | 28.88 |
| T | 15 | 16 | 6.67 |
| ∆β | 10.0 | 9.7665 | 2.33 |
| ∆ζ | 5.0 | 4.3708 | 12.58 |
| βinit | 35.0 | 40.4649 | 15.61 |
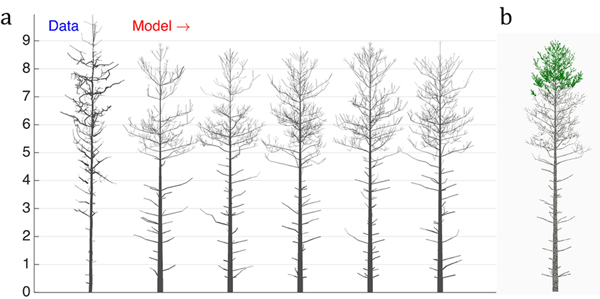
Fig. 4. The 16-parameter optimization of the stochastic LIGNUM model against a real pine tree (Data): a) tree shapes of the data tree (leftmost) and five realizations of the stochastic LIGNUM trees fitted to the data, and b) a LIGNUM tree sample with foliage. The data do not include information on foliage. The five “cloned” stochastic tree models all resemble each other in form, but differ in details. The optimal LIGNUM parameters estimated: LR = N(0.01,0.002), Q = N(0.11,0.03), T = 32, SL = 0.87 m, Smax = 72.4, Renv = N(0.83,0.23) m, βinit = 34.6 degree, ∆β = 5.5 degree, ∆ζ = 8.9 degree, βmax = 77.1 degree, ∆γ = 7.6 degree, Tsh = 12, µsh = 5.2, where N(x,y) denotes the normal distribution with mean x and standard deviation y. Other LIGNUM parameters are from Sievänen et al. (2008) and R = 60.0, VS = 0.02 m. See the parameter definitions in Table 1. The genetic algorithm has stopped after 24 full iterations/generations, where each generation consisted of 50 parameter sets.