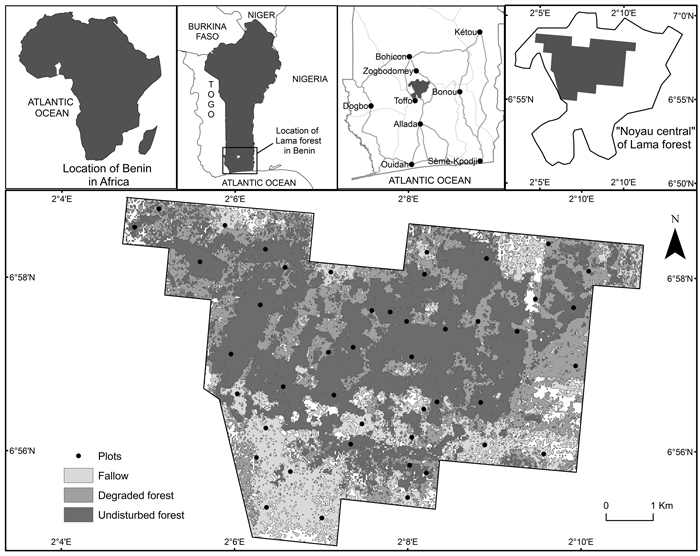
Fig. 1. Location of the study area.
| Table 1. Compilation of measurements of diameter and height for each sampled tree. | |||||
| Species | Number of sample trees | Number of diameter measurement | Dbh range (cm) | Stem height range (m) | Total height range (m) |
| Lonchocarpus sericeus | 23 | 145 | 3.2–38.5 | 2.28–20.48 | 2.28–24.15 |
| Drypetes floribunda | 28 | 162 | 2.4–31.5 | 2–9.96 | 2–12.09 |
| Albizia zygia | 28 | 168 | 2.5–65.5 | 3.03–26.73 | 3.03–28.08 |
| Lecaniodiscus cupanioides | 22 | 118 | 3.3–29.3 | 3.67–13.86 | 4.1–15.82 |
| Ficus sur | 27 | 163 | 4.4–67.7 | 3.25–21.85 | 3.25–26.64 |
| Zanthoxylum zanthoxyloides | 19 | 119 | 4.2–31.6 | 3.42–10.34 | 4.33–12.06 |
| Mimusops andongensis | 26 | 164 | 3.9–46.4 | 4–20.7 | 4–23 |
| Celtis brownii | 27 | 159 | 3.3–29.3 | 2.31–14.56 | 2.31–16.38 |
| Sterculia tragacantha | 31 | 194 | 2.9–34.6 | 2.02–16.2 | 2.02–18.8 |
| Cassipourea congoensis | 28 | 143 | 2.8–22.4 | 3.22–18.7 | 3.22–22.66 |
| Khaya senegalensis | 27 | 160 | 3.7–40.2 | 3.05–19.5 | 4.35–24 |
| Holarrhena floribunda | 32 | 187 | 2.9–41.3 | 2.1–20.25 | 2.1–23.25 |
| Cynometra megalophylla | 19 | 122 | 2.9–36 | 5.35–19.32 | 5.35–21.28 |
| Malacantha alnifolia | 27 | 169 | 2.9–31.9 | 3.6–13.72 | 3.6–17.92 |
| Terminalia superba | 37 | 240 | 8.2–44.4 | 6.32–26.04 | 9.44–33.93 |
| Triplochiton scleroxylon | 48 | 309 | 2.3–47.5 | 2.4–25.44 | 2.4–30.52 |
| Diospyros abyssinica | 18 | 109 | 1.8–32.7 | 3–19.26 | 3–22.14 |
| Holoptelea grandis | 34 | 207 | 3.5–32.9 | 4.62–22.54 | 5.4–25.3 |
| Table 2. Mean wood density (g cm−3) of the selected tree species in Lama forest reserve and comparison with other published data; wood density range includes all observations without modification. Wood density is given as oven-dry mass per fresh volume. | ||||||||
| Species | This study | Others studies | ||||||
| Number of wood sample | Wood Density range | Mean (Standard deviation) | Coefficient of varation (%) | Brown 1997 | Kindt et al. 2015 | IPCC 2006 | Zanne et al. 2009 | |
| C. megalophylla | 34 | 0.81–1.3 | 0.98 (0.08) | 7.96 | - | - | - | - |
| D. abyssinica | 31 | 0.45–1.90 | 0.86 (0.29) | 33.73 | - | 0.83 | - | - |
| Z. zanthoxyloides | 33 | 0.65–1.43 | 0.84 (0.14) | 16.62 | - | - | - | - |
| D. floribunda | 46 | 0.51–1.07 | 0.77 (0.12) | 15.67 | - | - | - | - |
| M. andongensis | 48 | 0.42–0.98 | 0.77 (0.11) | 14.51 | - | - | - | - |
| L. cupanioides | 36 | 0.42–1.03 | 0.77 (0.14) | 17.86 | - | - | - | - |
| C. congoensis | 39 | 0.62–0.83 | 0.75 (0.05) | 6.64 | - | - | - | 0.66 |
| L. sericeus | 42 | 0.48–0.95 | 0.75 (0.11) | 14.15 | - | 0.70 | - | 0.75 |
| C. brownii | 42 | 0.52–0.98 | 0.73 (0.09) | 13.04 | - | 0.72 | - | - |
| A. zygia | 52 | 0.44–0.73 | 0.65 (0.08) | 13.31 | 0.46 | 0.51 | - | 0.49 |
| H. grandis | 58 | 0.42–0.76 | 0.63 (0.09) | 14.08 | 0.59 | 0.61 | 0.59 | 0.59 |
| M. alnifolia | 46 | 0.48–0.73 | 0.61 (0.06) | 9.24 | 0.45 | - | 0.45 | - |
| K. senegalensis | 52 | 0.41–0.74 | 0.59 (0.07) | 11.83 | 0.60 | 0.66 | - | 0.63 |
| T. superba | 74 | 0.37–0.69 | 0.56 (0.06) | 10.74 | 0.45 | 0.46 | 0.40–0.66 | 0.46 |
| H. floribunda | 57 | 0.43–0.61 | 0.54 (0.04) | 8.32 | - | 0.47 | - | 0.47 |
| T. scleroxylon | 86 | 0.35–0.6 | 0.46 (0.07) | 15.11 | 0.32 | - | 0.28–0.44 | 0.33 |
| F. sur | 50 | 0.32–0.52 | 0.45 (0.05) | 11.97 | - | - | - | - |
| S. tragacantha | 47 | 0.16–0.44 | 0.32 (0.08) | 25.80 | - | - | - | - |
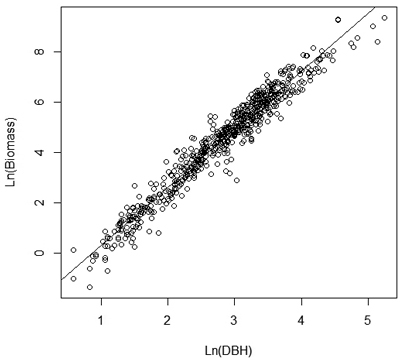
Fig. 2. Linear relationship with constant variance between ln (biomass) and ln(Dbh).
| Table 3. Total stem volume models, parameter estimates, standard errors of parameter estimates, adjusted coefficients of determination, relative RMSEs and bias correction. V = Volume (10−3 m3); Dbh = the Dbh at 1.3 m (cm); H = tree stem height (m); x0, x1 and x2 are model parameters; RMSE = root mean square error; σ = model residual standard deviation. Stem is described as height to crown base. Figures in brackets are standard errors of the parameters. | |||||||
| Species | Model parameters | Adjusted R2 (%) | Relative RMSE (%) | σ2/2 | df | ||
| x0 | x1 | x2 | |||||
| Model structure: ln(V) = x0 + x1ln(Dbh) | |||||||
| H. grandis | –1.58*** (0.11) | 2.36*** (0.04) | 99.03 | 15 | 0.01 | 32 | |
| T. scleroxylon | –1.96*** (0.10) | 2.48*** (0.03) | 99.13 | 17 | 0.02 | 46 | |
| C. congoensis | –1.90*** (0.11) | 2.53*** (0.05) | 98.74 | 17 | 0.02 | 26 | |
| D. abyssinica | –1.92*** (0.21) | 2.51*** (0.08) | 98.28 | 24 | 0.04 | 16 | |
| Z. zanthoxyloides | –1.71*** (0.18) | 2.37*** (0.07) | 98.6 | 18 | 0.02 | 17 | |
| A. zygia | –1.83*** (0.13) | 2.49*** (0.04) | 99.3 | 18 | 0.02 | 26 | |
| K. senegalensis | –1.76*** (0.15) | 2.33*** (0.05) | 98.71 | 18 | 0.02 | 25 | |
| M. andongensis | –1.71*** (0.15) | 2.35*** (0.05) | 98.86 | 18 | 0.02 | 24 | |
| C. brownii | –1.80*** (0.16) | 2.37*** (0.06) | 98.18 | 23 | 0.02 | 25 | |
| S. tragacantha | –1.47*** (0.18) | 2.31*** (0.06) | 97.66 | 24 | 0.03 | 29 | |
| C. megalophylla | –1.52*** (0.13) | 2.31*** (0.05) | 99.28 | 14 | 0.01 | 17 | |
| L. sericeus | –1.81*** (0.14) | 2.42*** (0.05) | 99.13 | 17 | 0.02 | 21 | |
| H. floribunda | –1.63*** (0.09) | 2.36*** (0.03) | 99.39 | 14 | 0.01 | 30 | |
| D. floribunda | –1.53*** (0.13) | 2.23*** (0.05) | 98.53 | 19 | 0.02 | 26 | |
| L. cupanioides | –1.38*** (0.21) | 2.24*** (0.09) | 96.88 | 23 | 0.03 | 20 | |
| M. alnifolia | –1.46*** (0.09) | 2.23*** (0.04) | 99.34 | 13 | 0.01 | 25 | |
| T. superba | –1.52*** (0.12) | 2.35*** (0.04) | 99.06 | 11 | 0.01 | 35 | |
| F. sur | –1.55*** (0.13) | 2.30*** (0.04) | 99.22 | 15 | 0.01 | 25 | |
| Generic | –1.48*** (0.04) | 2.29*** (0.01) | 97.51 | 32 | 0.05 | 615 | |
| Model structure: ln(V) = x0 + x1ln(Dbh) + x2ln(H) | |||||||
| H. grandis | –2.10*** (0.11) | 1.95*** (0.07) | 0.66*** (0.10) | 99.56 | 11 | 0.01 | 31 |
| T. scleroxylon | –2.33*** (0.07) | 2.04*** (0.05) | 0.64*** (0.07) | 99.7 | 10 | 0.01 | 45 |
| C. congoensis | –2.36*** (0.17) | 2.15*** (0.12) | 0.60** (0.18) | 99.09 | 14 | 0.01 | 25 |
| D. abyssinica | –2.60*** (0.26) | 1.96*** (0.18) | 0.91** (0.27) | 98.94 | 19 | 0.03 | 15 |
| Z. zanthoxyloides | –2.63*** (0.21) | 2.30*** (0.04) | 0.53*** (0.10) | 99.46 | 11 | 0.01 | 16 |
| A. zygia | –2.10*** (0.10) | 2.15*** (0.07) | 0.52*** (0.09) | 99.69 | 12 | 0.01 | 25 |
| K. senegalensis | –1.90*** (0.10) | 1.89*** (0.08) | 0.62*** (0.10) | 99.46 | 11 | 0.01 | 24 |
| M. andongensis | –2.17*** (0.10) | 1.99*** (0.05) | 0.64*** (0.08) | 99.66 | 10 | 0.01 | 23 |
| C. brownii | –1.95*** (0.11) | 2.04*** (0.08) | 0.48*** (0.09) | 99.12 | 14 | 0.01 | 24 |
| S. tragacantha | –1.75*** (0.11) | 1.84*** (0.07) | 0.69*** (0.09) | 99.21 | 14 | 0.01 | 28 |
| C. megalophylla | –1.97*** (0.27) | 2.17*** (0.09) | 0.35. (0.19) | 99.38 | 12 | 0.01 | 16 |
| L. sericeus | –2.03*** (0.11) | 2.07*** (0.08) | 0.50*** (0.11) | 99.56 | 12 | 0.01 | 20 |
| H. floribunda | –1.95*** (0.07) | 2.11*** (0.04) | 0.44*** (0.06) | 99.75 | 9 | 0.00 | 29 |
| D. floribunda | –2.06*** (0.10) | 2.03*** (0.04) | 0.59*** (0.07) | 99.58 | 10 | 0.01 | 25 |
| L. cupanioides | –2.14*** (0.18) | 1.92*** (0.07) | 0.72*** (0.12) | 98.9 | 13 | 0.01 | 19 |
| M. alnifolia | –1.85*** (0.17) | 2.08*** (0.07) | 0.39* (0.15) | 99.46 | 12 | 0.01 | 24 |
| T. superba | –1.93*** (0.12) | 2.14*** (0.05) | 0.39*** (0.08) | 99.43 | 9 | 0.00 | 34 |
| F. sur | –1.85*** (0.13) | 2.15*** (0.13) | 0.32*** (0.09) | 99.47 | 12 | 0.01 | 24 |
| Generic | –2.10*** (0.04) | 2.00*** (0.02) | 0.63*** (0.53) | 98.71 | 24 | 0.02 | 614 |
| Table 4. Total stem biomass models, parameter estimates, standard errors of parameter estimates, adjusted coefficients of determination, relative RMSEs and bias correction. X = Biomass (kg); Dbh = the Dbh at 1.3 m (cm); H = tree stem height (m); x0, x1 and x2 are model parameters; RMSE = root mean square error; σ = model residual standard deviation. Stem is described as height to crown base. Figures in brackets are standard errors of the parameters. | |||||||
| Species | Model parameters | Adjusted R2 (%) | Relative RMSE (%) | σ2/2 | df | ||
| x0 | x1 | x2 | |||||
| Model structure: ln(X) = x0 + x1ln(Dbh) | |||||||
| H. grandis | –2.44*** (0.10) | 2.51*** (0.04) | 99.23 | 16 | 0.01 | 32 | |
| T. scleroxylon | –2.64*** (0.14) | 2.44*** (0.05) | 98.24 | 24 | 0.03 | 46 | |
| C. congoensis | –2.25*** (0.12) | 2.56*** (0.06) | 98.6 | 17 | 0.02 | 26 | |
| D. abyssinica | –2.06*** (0.29) | 2.49*** (0.11) | 96.74 | 34 | 0.08 | 16 | |
| Z. zanthoxyloides | –2.36*** (0.21) | 2.55*** (0.08) | 98.27 | 22 | 0.02 | 17 | |
| A. zygia | –2.63*** (0.17) | 2.60*** (0.05) | 98.92 | 23 | 0.03 | 26 | |
| K. senegalensis | –2.50*** (0.16) | 2.40*** (0.06) | 98.56 | 22 | 0.02 | 25 | |
| M. andongensis | –1.98*** (0.20) | 2.35*** (0.07) | 97.99 | 24 | 0.03 | 24 | |
| C. brownii | –2.30*** (0.18) | 2.44*** (0.07) | 97.89 | 23 | 0.03 | 25 | |
| S. tragacantha | –2.93*** (0.22) | 2.40*** (0.08) | 96.48 | 32 | 0.05 | 29 | |
| C. megalophylla | –1.68*** (0.16) | 2.37*** (0.06) | 98.99 | 17 | 0.02 | 17 | |
| L. sericeus | –2.39*** (0.17) | 2.53*** (0.06) | 98.76 | 21 | 0.02 | 21 | |
| H. floribunda | –2.33*** (0.11) | 2.39*** (0.04) | 99 | 18 | 0.02 | 30 | |
| D. floribunda | –2.09*** (0.16) | 2.35*** (0.06) | 98.15 | 22 | 0.03 | 26 | |
| L. cupanioides | –2.21*** (0.25) | 2.47*** (0.10) | 96.44 | 27 | 0.04 | 20 | |
| M. alnifolia | –1.91*** (0.12) | 2.21*** (0.04) | 98.94 | 17 | 0.02 | 25 | |
| T. superba | –2.38*** (0.16) | 2.45*** (0.05) | 98.31 | 16 | 0.01 | 35 | |
| F. sur | –2.52*** (0.17) | 2.35*** (0.05) | 98.68 | 21 | 0.02 | 25 | |
| Generic | –1.98*** (0.06) | 2.30*** (0.02) | 95.07 | 45 | 0.10 | 615 | |
| Model structure: ln(X) = x0 + x1ln(Dbh) + x2ln(H) | |||||||
| H. grandis | –2.72*** (0.14) | 2.28*** (0.09) | 0.35516* (0.14) | 99.35 | 14 | 0.01 | 31 |
| T. scleroxylon | –3.15*** (0.11) | 1.86*** (0.08) | 0.86*** (0.10) | 99.28 | 16 | 0.01 | 45 |
| C. congoensis | –2.71*** (0.17) | 2.21*** (0.13) | 0.58** (0.19) | 99.06 | 15 | 0.01 | 25 |
| D. abyssinica | –2.81*** (0.41) | 1.88*** (0.28) | 1.00* (0.43) | 97.45 | 33 | 0.06 | 15 |
| Z. zanthoxyloides | –3.38*** (0.28) | 2.48*** (0.59) | 0.58*** (0.14) | 99.14 | 14 | 0.01 | 16 |
| A. zygia | –2.99*** (0.12) | 2.14*** (0.08) | 0.70*** (0.11) | 99.55 | 15 | 0.01 | 25 |
| K. senegalensis | –2.64*** (0.12) | 1.97*** (0.10) | 0.60*** (0.13) | 99.2 | 15 | 0.01 | 24 |
| M. andongensis | –2.43*** (0.20) | 2.00*** (0.11) | 0.63*** (0.16) | 98.72 | 18 | 0.02 | 23 |
| C. brownii | –2.46*** (0.13) | 2.08*** (0.09) | 0.52*** (0.11) | 98.88 | 16 | 0.01 | 24 |
| S. tragacantha | –3.23*** (0.18) | 1.90*** (0.12) | 0.74*** (0.15) | 98.03 | 21 | 0.03 | 28 |
| C. megalophylla | –2.50*** (0.28) | 2.11*** (0.09) | 0.63** (0.19) | 99.36 | 13 | 0.01 | 16 |
| L. sericeus | –2.58*** (0.17) | 2.23*** (0.13) | 0.43* (0.17) | 99.02 | 18 | 0.01 | 20 |
| H. floribunda | –2.73*** (0.10) | 2.08*** (0.06) | 0.55*** (0.09) | 99.55 | 12 | 0.01 | 29 |
| D. floribunda | –2.63*** (0.15) | 2.14*** (0.06) | 0.60*** (0.11) | 99.11 | 16 | 0.01 | 25 |
| L. cupanioides | –2.99*** (0.25) | 2.14*** (0.10) | 0.74*** (0.17) | 98.16 | 19 | 0.02 | 19 |
| M. alnifolia | –2.35*** (0.22) | 2.03*** (0.09) | 0.44* (0.19) | 99.09 | 15 | 0.01 | 24 |
| T. superba | –2.83*** (0.19) | 2.21*** (0.08) | 0.43** (0.13) | 98.71 | 14 | 0.01 | 34 |
| F. sur | –2.94*** (0.17) | 2.14*** (0.07) | 0.45*** (0.12) | 99.16 | 16 | 0.01 | 24 |
| Generic | –2.63*** (0.07) | 1.99*** (0.03) | 0.67*** (0.04) | 96.35 | 39 | 0.07 | 614 |
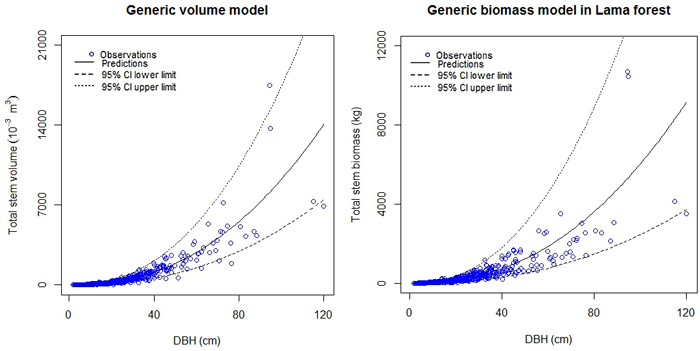
Fig. 3. Generic models for stem volume and stem biomass in Lama forest reserve.
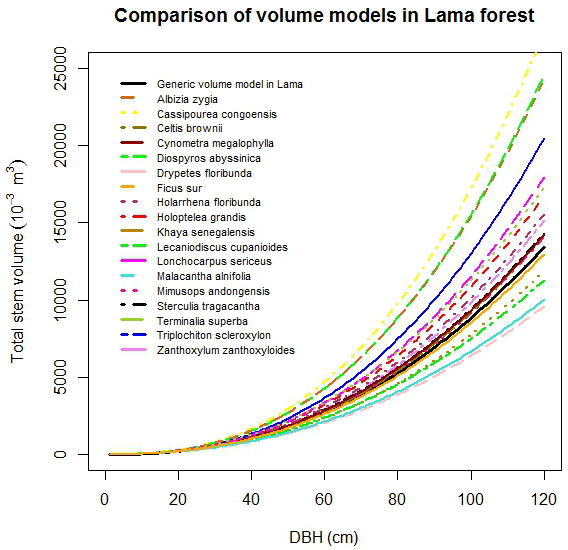
Fig. 4. Comparison of stem volume functions by selected tree species.
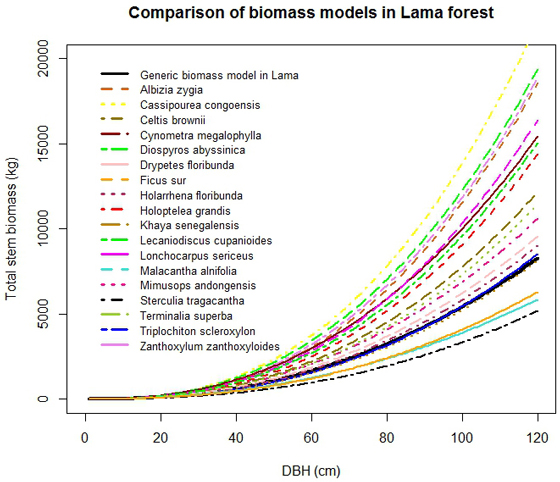
Fig. 5. Comparison of stem biomass functions by selected tree species.