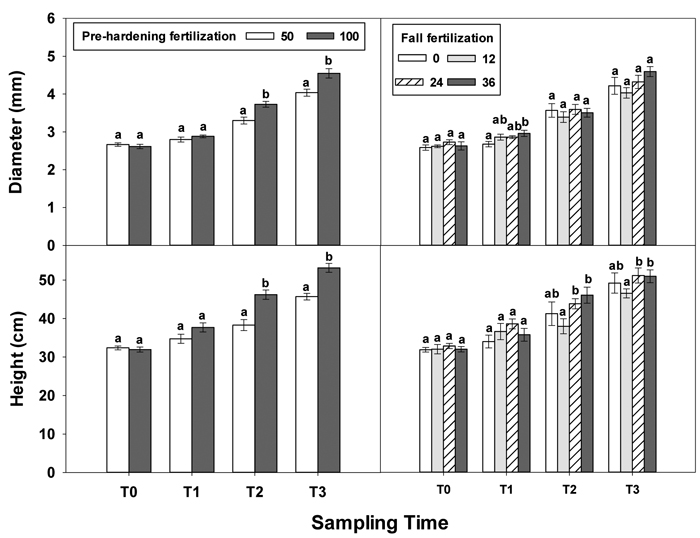
Fig. 1. Main effects of pre-hardening fertilization (50, 100 mg N seedling–1) and fall fertilization (0, 12, 24, 36 mg N seedling–1) on height and diameter (Means ± SE) of Quercus variabilis seedlings at transplanting (T0), at the end of establishment (T1), rapid growing (T2) and hardening (T3) stages after transplantation. Bars marked with different letters differ statistically for each stage according to Duncan`s test = 0.05.
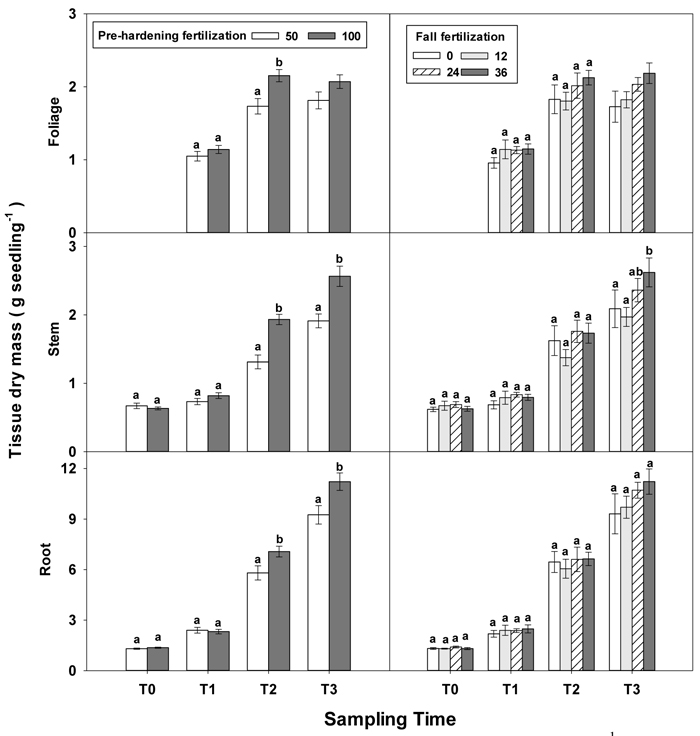
Fig. 2. Main effects of pre-hardening fertilization (50, 100 mg N seedling–1) and fall fertilization (0, 12, 24, 36 mg N seedling–1) on tissue dry mass (Means ± SE) of Quercus variabilis seedlings at transplanting (T0), at the end of establishment (T1), rapid growing (T2) and hardening (T3) stages after transplantation. Bars marked with different letters differ statistically for each tissue within the same stage according to Duncan`s test = 0.05. Because of the significant interaction effect between pre-hardening and fall fertilization, the mean foliage dry mass response at T3 was not presented. Foliage dry mass at T0 stage was not presented due to the absence of leaves for the deciduous tree species at transplanting.
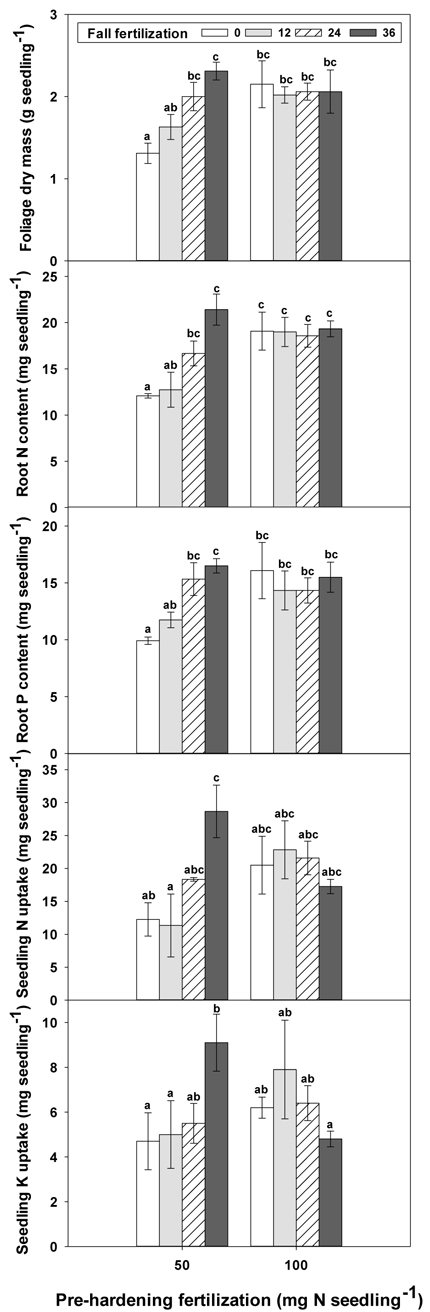
Fig. 3. The interaction of pre-hardening fertilization (50, 100 mg N seedling–1) and fall fertilization (0, 12, 24, 36 mg N seedling–1) on Quercus variabilis seedlings foliage dry mass at the end of hardening stage (T3), root N content at the end of establishment stage (T1), and root P content at the end of hardening stage (T3), and on seedling N and K uptake from soil during establishment stage (T1-T0) after transplantation. Bars marked with different letters differ statistically according to Duncan`s test = 0.05.
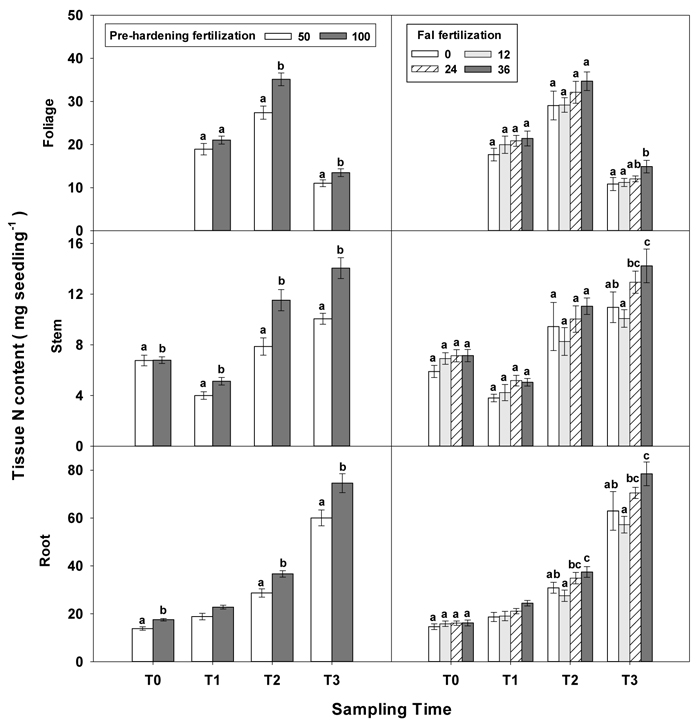
Fig. 4. Main effects of pre-hardening fertilization (50, 100 mg N seedling–1) and fall fertilization (0, 12, 24, 36 mg N seedling–1) on tissue N content (Means ± SE) of Quercus variabilis seedlings at transplanting (T0), at the end of establishment (T1), rapid growing (T2) and hardening (T3) stages after transplantation. Bars marked with different letters differ statistically for each tissue within the same stage according to Duncan`s test = 0.05. Foliage N content at T0 stage was not presented due to the absence of leaves for the deciduous tree species at transplanting.
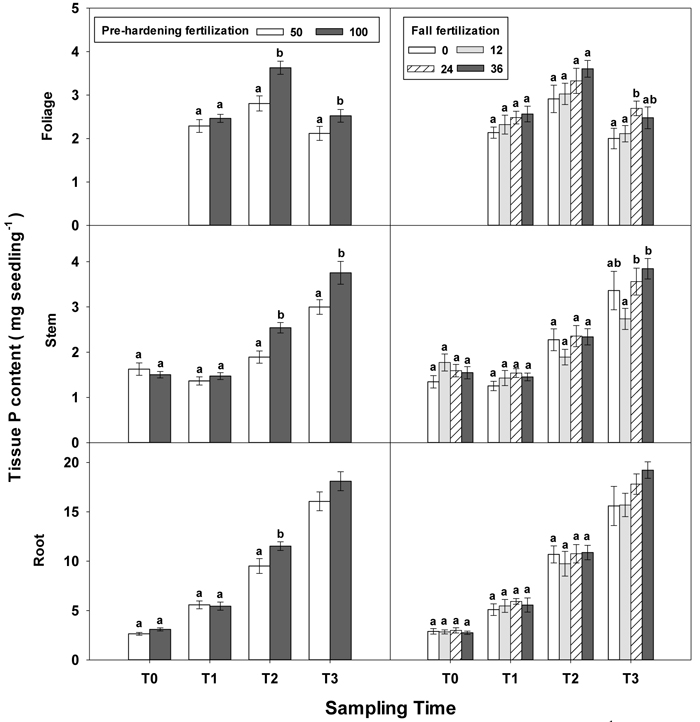
Fig. 5. Main effects of pre-hardening fertilization (50, 100 mg N seedling–1) and fall fertilization (0, 12, 24, 36 mg N seedling–1) on tissue P content (Means ± SE) of Quercus variabilis seedlings at transplanting (T0), at the end of establishment (T1), rapid growing (T2) and hardening (T3) stages after transplantation. Bars marked with different letters differ statistically for each tissue within the same stage according to Duncan`s test = 0.05. Because of the significant interaction effect between pre-hardening and fall fertilization, the mean root P content response at T3 was not presented. Foliage P content at T0 stage was not presented due to the absence of leaves for the deciduous tree species at transplanting.
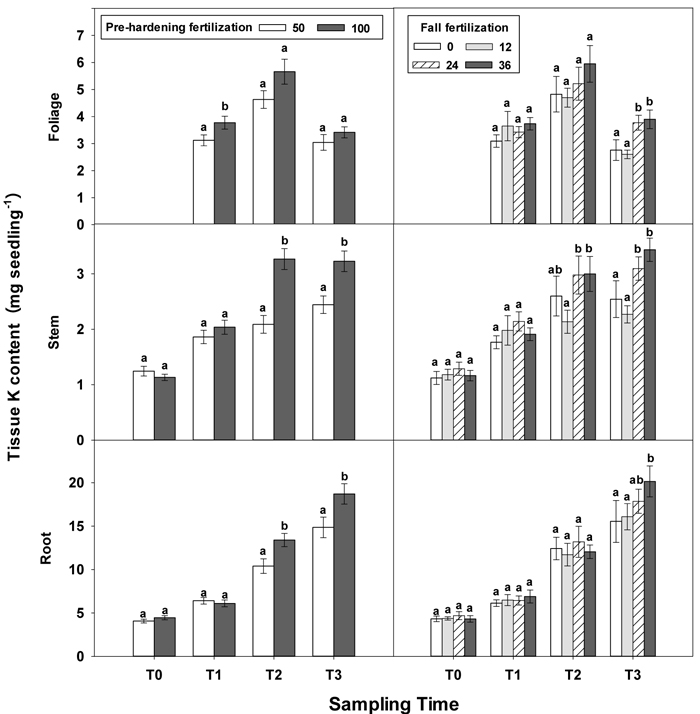
Fig. 6. Main effects of pre-hardening fertilization (50, 100 mg N seedling–1) and fall fertilization (0, 12, 24, 36 mg N seedling–1) on tissue K content (Means ± SE) of Quercus variabilis seedlings at transplanting (T0), at the end of establishment (T1), rapid growing (T2) and hardening (T3) stages after transplantation. Bars marked with different letters differ statistically for each tissue within the same stage according to Duncan`s test = 0.05. Foliage K content at T0 stage was not presented due to the absence of leaves for the deciduous tree species at transplanting.
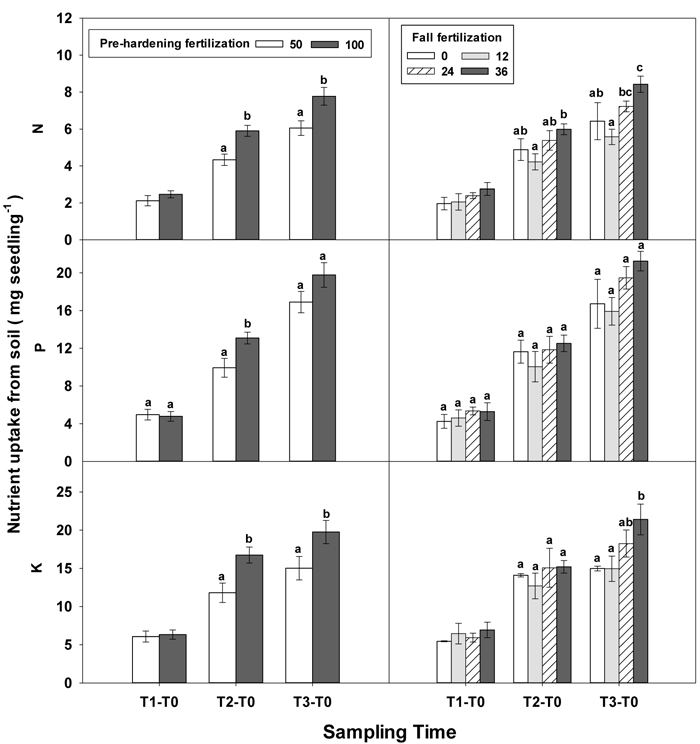
Fig. 7. Main effects of pre-hardening fertilization (50, 100 mg N seedling–1) and fall fertilization (0, 12, 24, 36 mg N seedling–1) on N, P and K uptake of Quercus variabilis seedlings from soil during establishment (T1-T0), from transplanting to the rapid growing (T2-T0) and hardening (T3-T2) stages and the whole growing season (T3-T0) after transplantation. Bars marked with different letters differ statistically for each stage according to Duncan`s test = 0.05. Because of the significant interaction effect between pre-hardening and fall fertilization, the mean N and K uptake from soil at T1-T0 stage was not presented.