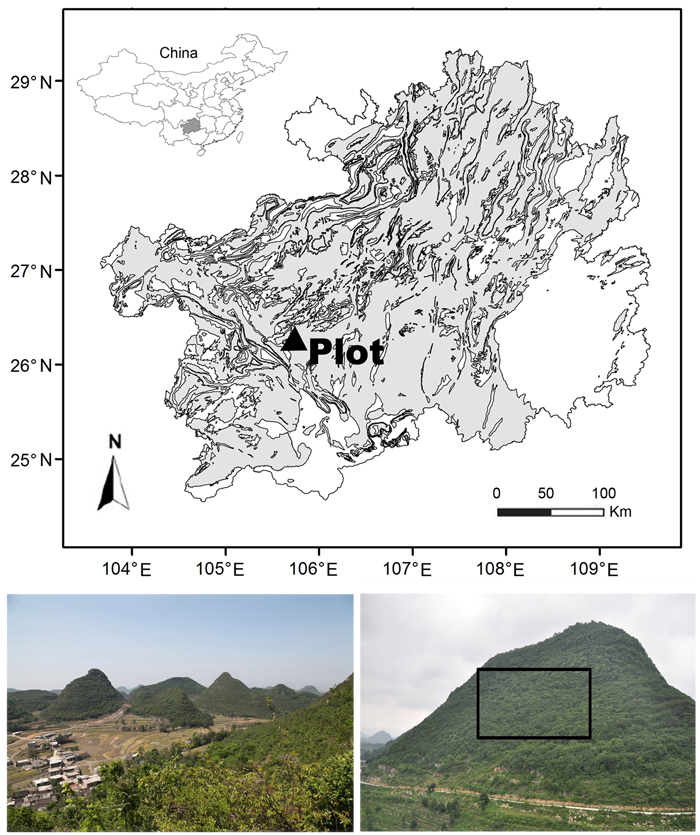
Fig. 1. Location and physiognomy of the Houzhaihe River catchment (left bottom) and the Tianlongshan permanent monitoring plot (right bottom) in the distribution map of karst terrain (the grey) in Guizhou province, southwestern China.
| Table 1. Biomass models used for predicting woody species biomass of karst evergreen and deciduous broad-leaved mixed forest in central Guizhou province, southwestern China. Species identification was based on Chen (1982–2004). The units of biomass, DBH (or basal diameter), and height (or length) in the studies of Liu et al. (2009), Liu et al. (2013), and Yang et al. (2003) were g, cm and cm, respectively; those in the studies of Zhu et al. (1995), Deng et al. (2000), He et al. (2007), and Yuan et al. (2009) were kg, cm and m, respectively. | ||||
| Species / DBH classes (cm) | Biomass models | Correlation coefficient | References | |
| Trees | Platycarya strobilacea Sieb. et Zucc. | W = 1.9611(D2H)0.8921 | 0.9886 | Liu et al. 2009 |
| Lithocarpus confinis Huang | W = 0.8967(D2H)0.9636 | 0.9817 | Liu et al. 2009 | |
| Itea yunnanensis Franch. | W = 1.9545(D2H)0.8996 | 0.9568 | Liu et al. 2009 | |
| Machilus cavaleriei Levl. | W = 2.6211(D2H)0.8565 | 0.9733 | Liu et al. 2009 | |
| Carpinus pubescens Burk. | Wl = 0.3644(D2H)0.7443 | 0.971 | Liu et al. 2013 | |
| Ww = 0.8076(D2H)0.9378 | 0.998 | Liu et al. 2013 | ||
| Pittosporum brevicalyx (Oliv.) Gagnep | W = 0.0755(D2H)0.8941 | 0.9872 | Zhu et al. 1995 | |
| Lindera communis Hemsl. | W = 0.0755(D2H)0.8941 | 0.9872 | Zhu et al. 1995 | |
| Ilex: Ilex corallina Franch., Ilex macrocarpa Oliv. | W = 0.0755(D2H)0.8941 | 0.9872 | Zhu et al. 1995 | |
| Kalopanax septemlobus (Thunb.) Koidz. | W = 1.1416(D2H)0.8828 | 0.9967 | Liu et al. 2009 | |
| Lauraceae: Cinnamomum bodinieri Levl., Lindera pulcherrima var. hemsleyana, Litsea rubescens Lec. | Wt = 1.728 + 0.015D2H | 0.938 | He et al. 2007 | |
| Wr = 0.379 + 0.002D2H | 0.982 | He et al. 2007 | ||
| Celtis sinensis Pers., llex franchetiana Loes., lbizia kalkora (Roxb.) Prain | Log Ws = 0.75995logD2H – 0.75237 | 0.948 | Deng et al. 2000 | |
| Log Wb = 0.69997logD2H – 0.93934 | 0.959 | Deng et al. 2000 | ||
| Log Wl = 0.53231logD2H – 0.96854 | 0.915 | Deng et al. 2000 | ||
| Other trees (D > 5.0) | W = 0.5834(D2H) – 8.151 | 0.9584 | Liu et al. 2009 | |
| Other trees (1.0 ≤ D ≤5.0) | W = 2.0141(D2H)0.889 | 0.9228 | Liu et al. 2009 | |
| Shrubs and tree seedlings | Rhamnus leptophylla Schneid | W = 0.9598(d2H)0.8849 | 0.9569 | Liu et al. 2009 |
| Lindera pulcherrima var. hemsleyana | W = 1.3295(d2H)0.835 | 0.9388 | Liu et al. 2009 | |
| Zanthoxylum ovalifolium var. spinifolium | W = 0.5379(d2H) + 29.405 | 0.9359 | Liu et al. 2009 | |
| Myrsine africana L. | W = 0.5757(d2H) + 18.309 | 0.8144 | Liu et al. 2009 | |
| Zanthoxylum esquirolii Levi., Zanthoxylum calcicola Huang | W = 1.1807(d2H) + 1.1754 | 0.9849 | Liu et al. 2009 | |
| Lindera communis | W = 2.2795(d2H)0.7636 | 0.9619 | Liu et al. 2009 | |
| Rhamnus heterophylla Oliv. | W = 0.9598(d2H)0.8849 | 0.9005 | Liu et al. 2009 | |
| Stachyurus obovatus (Rehd.) Hand.-Mazz. | W = 0.1867(d2H)1.2003 | 0.9406 | Liu et al. 2009 | |
| Others (D < 1.0) | W = 0.5418(d2H) + 17.287 | 0.7817 | Liu et al. 2009 | |
| 1.0 ≤ D ≤5.0 | W = 0.5834(D2H) – 8.151 | 0.9228 | Liu et al. 2009 | |
| D > 5.0 | W = 2.0141(D2H)0.889 | 0.9228 | Liu et al. 2009 | |
| Lianas and vines | D > 1.0 | Ws = 0.8745(D2H)0.7846 | 0.9278 | Yang et al. 2003 |
| Wl = 0.2556(D2H)0.8224 | 0.932 | Yang et al. 2003 | ||
| D ≤ 1.0 | Ln(W) = –1.423 + 2.155Ln(d) | 0.7364 | Yuan et al. 2009 | |
| W: Aboveground biomass; Wl: Leaf biomass; Ww: Wood biomass; Wt: Total biomass; Wr: Root biomass; Ws: Stem biomass; Wb: Branch biomass; D: Diameter at breast height; d: Basal diameter; H: Height or length | ||||
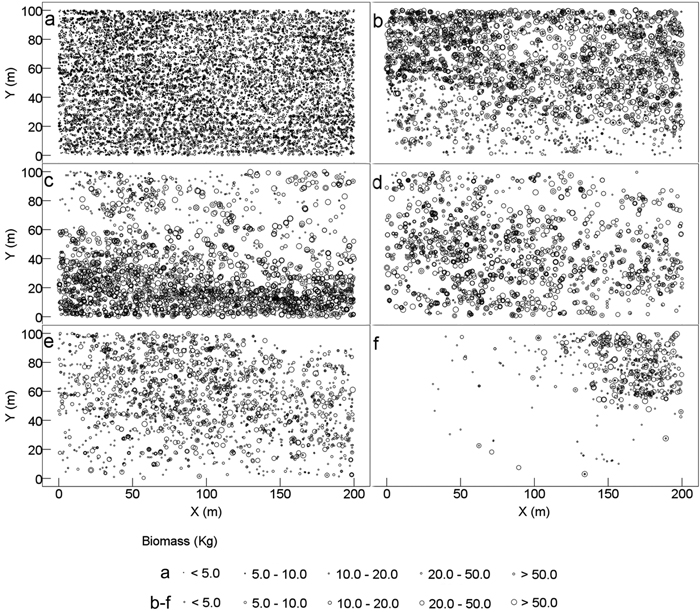
Fig. 2. Spatial distribution pattern of tree aboveground biomass of karst evergreen and deciduous broad-leaved mixed forest in central Guizhou province, southwestern China. (a) all trees, (b) Lithocarpus confinis, (c) Platycarya strobilacea, (d) Itea yunnanensis, (e) Machilus cavaleriei, and (f) Carpinus pubescens. X: the distance from east to west of the plot; Y: the distance from south to north of the plot.
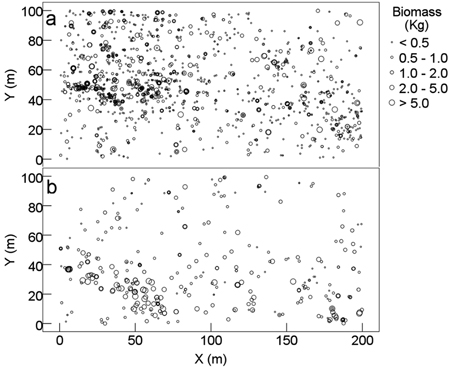
Fig. 3. Spatial distribution pattern of aboveground biomass of shrubs and lianas and vines of karst evergreen and deciduous broad-leaved mixed forest in central Guizhou province, southwestern China. (a) shrubs (DBH ≥ 1 cm) and (b) lianas and vines (DBH ≥ 1 cm). X: the distance from east to west of the plot; Y: the distance from south to north of the plot.
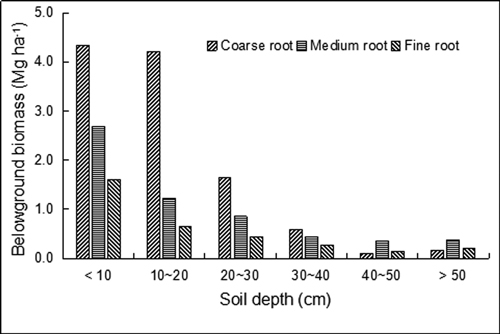
Fig. 4. Belowground biomass of karst evergreen and deciduous broad-leaved mixed forest in central Guizhou province, southwestern China. Coarse root (root diameter ≥ 10 mm), medium root (2–10 mm), and fine root (≤ 2 mm).
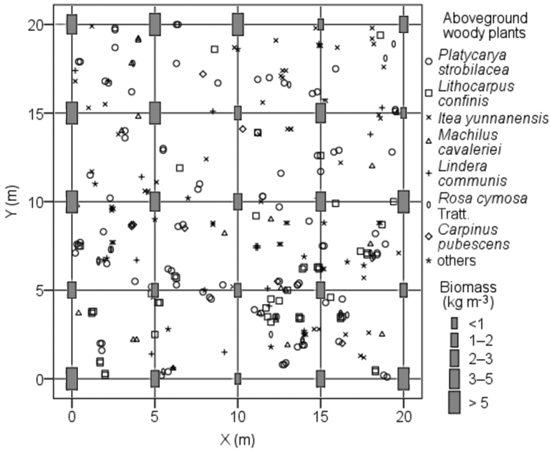
Fig. 5. Spatial distribution of aboveground woody plants and soil pits with its belowground biomass in root sampling quadrat of karst evergreen and deciduous broad-leaved mixed forest in central Guizhou province, southwestern China. X: the distance from west to east of the quadrat; Y: the distance from south to north of the quadrat.
| Table 2. Comparison of biomass between karst and nonkarst forests in southern China. View in new window/tab. |