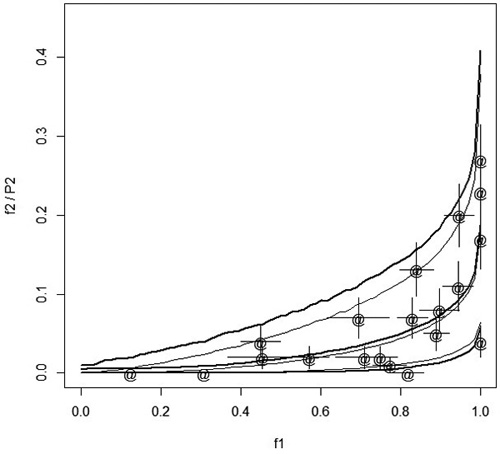
Fig. 1. Points (marked with ‘@’) show he relative frequencies of damaged treated seedlings, f2, in different stands with respect to the relative frequency of damaged control seedlings, f1. The error bars in both directions indicate the standard error computed as ![]() . The thin solid lines describe the median and 95% confidence interval when the probability of damage of treated seedlings, P2i, is predicted from f1 using the estimated model and simulation assuming that each stand has four plots with 17 seedlings in each plot. The thick solid lines show the median and 95% confidence interval when f2 is predicted from f1.
. The thin solid lines describe the median and 95% confidence interval when the probability of damage of treated seedlings, P2i, is predicted from f1 using the estimated model and simulation assuming that each stand has four plots with 17 seedlings in each plot. The thick solid lines show the median and 95% confidence interval when f2 is predicted from f1.
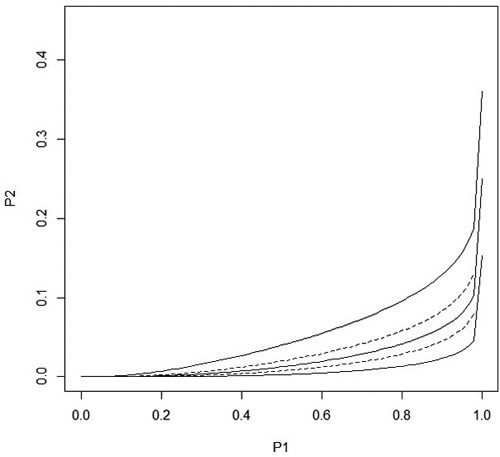
Fig. 2. The solid lines show the predicted stand level probability of damage ![]() and the 95% confidence interval in treated seedlings as a function of the stand level probability P1i of damage in control seedlings when distance to the humus is equal to its overall average. The maximum value for P1i is P1i = 0.9999995 which is the upper 95% confidence limit for P1i. The dashed lines are obtained when the distance to the humus is the average value ± sd. All curves go to one when P1i goes to one.
and the 95% confidence interval in treated seedlings as a function of the stand level probability P1i of damage in control seedlings when distance to the humus is equal to its overall average. The maximum value for P1i is P1i = 0.9999995 which is the upper 95% confidence limit for P1i. The dashed lines are obtained when the distance to the humus is the average value ± sd. All curves go to one when P1i goes to one.