| Table 1. Main characteristics of the eight research stands before and after uprooting. View in new window/tab. |
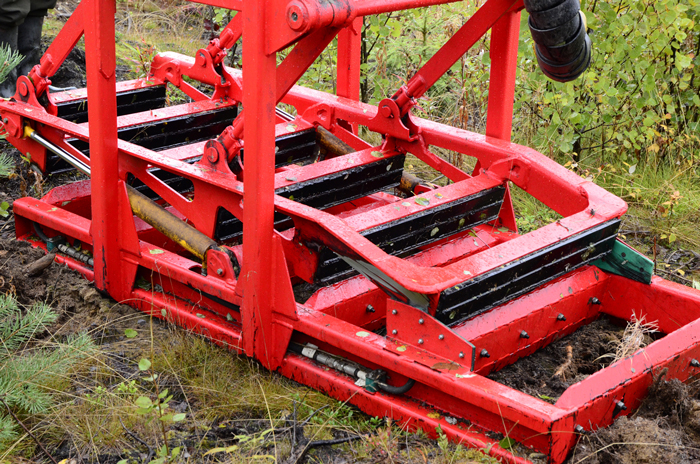
Fig. 1. Uprooting device P25_v1 (Photo: Ville Kankaanhuhta).
| Table 2. Uprooter productivity (PWh ha–1) in terms of time consumption. | |||||
| Time consumption (PWh ha–1) | |||||
| Uprooter | N | Min. | Mean | Max. | SD |
| P25_v1 | 4 | 6.0 | 7.0 | 7.8 | 0.8 |
| P25_v2 | 4 | 4.5 | 4.9 | 5.4 | 0.4 |
| Combined | 8 | 4.5 | 5.9 | 7.8 | 1.3 |
| Table 3. Regression model for time consumption of Naarva uprooters (N = 8). | ||||
| Variable | B | Standard error | t-value | p-value |
| Constant | 9.115 | 0.725 | 12.57 | <0.001 |
| [Uprooter = P25_v2] | –2.125 | 0.459 | –4.64 | <0.005 |
| R²= 0.78; R² (adj.) = 0.75 | ||||
| Table 4. Parameter estimates (SE in parentheses), χ2 test values and variance components of the sub-models for the number of individually grown Scots pine seedlings (n1), processing units (n2), and broadleaves (n3) on 20 m2 sample plots. | ||||||
| Sub-model for | ||||||
| Predictor | n1 | χ2 –value | n2 | χ2 -value | ln(n3+1) | χ2 -value |
| Intercept | 3.2152 (0.3378) | 90.58*** | 5.4616 (0.3229) | 286.05*** | 0.4580 (0.1097) | 17.43*** |
| Poor regeneration result | –1.7441 (0.3405) | 26.24*** | –2.3635 (0.4195) | 31.75*** | 0.1579 (0.1115) | 2.00 ns |
| Poor quality pine seedlings | 0.1541 (0.0769) | 4.02* | 0.4291 (0.1024) | 17.56*** | 0.0265 (0.0262) | 1.02 ns |
| Uprooter (P25_v2 vs. P25_v1) | 0.0205 (0.4397) | 0.002 ns | –0.3295 (0.3859) | 0.73 ns | –0.0662 (0.1417) | 0.22 ns |
| Random part: SD (uj) | 0.4905 (0.4306) | 0.1323 (0.3685) | 0.1490 (0.1386) | |||
| Random part: SD (eji) | 1.6013 (0.5432) | 2.2145 (0.7630) | 0.5628 (0.1910) | |||
| Note: for class variables (units not shown), value 0/1; 0 = Successful. The number of poor quality seedlings was counted at the sample plot level. * significant at 0.05, ***significant at 0.001 level. ns = non-significant at 0.05 level. | ||||||
| Table 5. Covariances of the random effects at the sample plot level (lower triangle) and random stand level errors (upper triangle) for the number of individually grown Scots pine seedlings (n1), processing units (n2) and broadleaves (n3). Standard errors and significances are shown in parentheses. | |||
| Response variable | n1 | n2 | ln(n3+1) |
| n1 | – | 0.1819 (0.1507 ns) | –0.0314 (0.044 ns) |
| n2 | 2.0482 (0.3378 ***) | – | –0.0317 (0.0361 ns) |
| ln(n3+1) | –0.0761 (0.0736 ns) | 0.7188 (0.1187 ***) | – |
| *** significant at 0.001 level, ns = non-significant at 0.05 level. | |||
| Table 6. Influence of fixed and random effects on the total variation of the number of individual Scots pine seedlings (n1), processing units (n2) and broadleaves (n3). | |||||||
| Full model | Empty model | Influence of fixed effects (%) | |||||
| Response | Variance estimate | Std. error | ICC (%) | Variance estimate | Std. error | ICC (%) | |
| Stand level | |||||||
| n1 | 0.2406 | 0.1854 | 8.6 | 0.5720 | 0.3651 | 15.5 | 58 |
| n2 | 0.0175 | 0.1358 | 0.4 | 0.5072 | 0.4218 | 7.3 | 97 |
| ln(n3+1) | 0.0222 | 0.0192 | 6.6 | 0.0223 | 0.0193 | 6.5 | 0.4 |
| Sample plot level | |||||||
| n1 | 2.5641 | 0.2951 | -- | 3.1265 | 0.3598 | -- | 18 |
| n2 | 4.9040 | 0.5821 | -- | 6.4720 | 0.7675 | -- | 24 |
| ln(n3+1) | 0.3167 | 0.0365 | -- | 0.3204 | 0.0369 | -- | 1 |
| Note: Full models are presented in Table 4. Empty models refer to sub-models estimated without fixed predictors. ICC refers to Intra Class Correlation. | |||||||