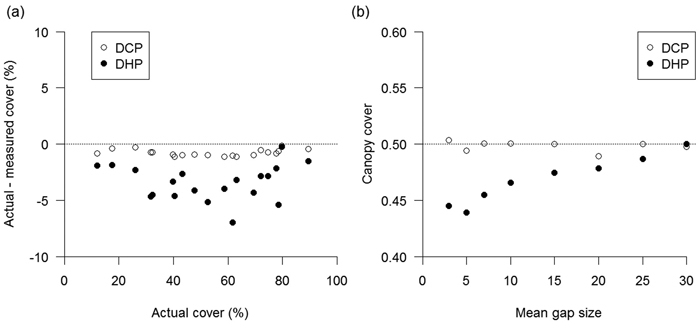
Fig. 1. a) Difference between the actual and measured canopy cover calculated from artificial canopy images with known canopy cover using digital hemispherical (DHP) and cover (DCP) photography; b) Variation of canopy cover with mean gap size calculated from artificial checkerboard-patterned canopy images using digital hemispherical (DHP) and cover (DCP) photography. Mean gap size ranges from 0.02% (3 mm) to 0.2% (30 mm) of the artificial canopy image area.
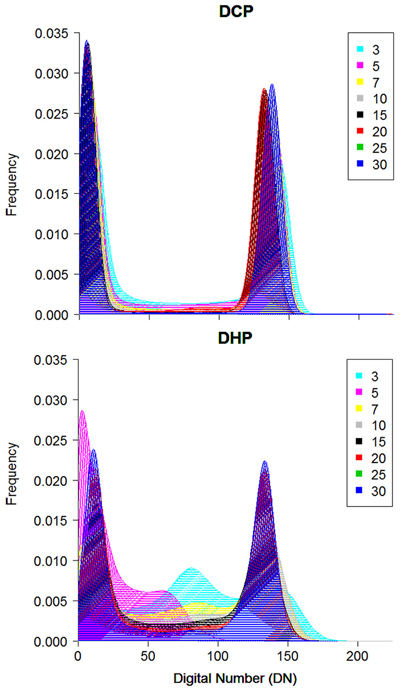
Fig. 2. Histograms of DCP (top) and DHP (bottom) images of artificial checkerboard-patterned canopy images with different mean gap size. The color classes in legend indicates different mean gap size ranging from 0.02% (3 mm, navy) to 0.2% (30 mm, blue) of the artificial canopy image area. View larger in new window/tab.
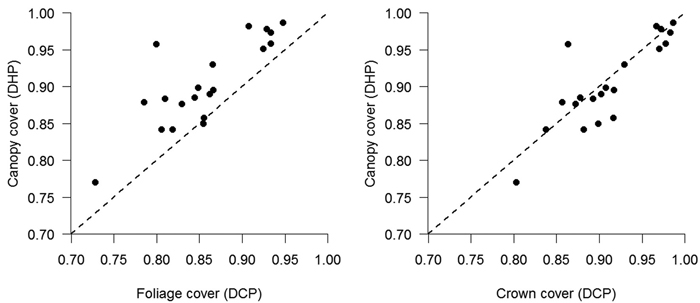
Fig. 3. Canopy cover from hemispherical photography (y-axis) vs either foliage cover (left) or crown cover (right) calculated from cover photography (x-axis) in studied stands in Italy. The dashed line indicates the 1:1 relationship.
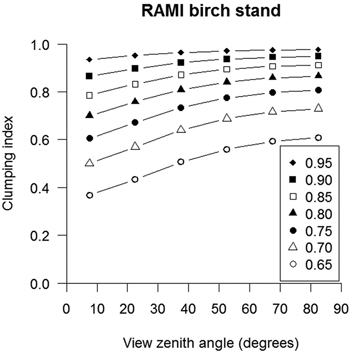
Fig. 4. Variation in foliage clumping index estimates with view zenith angle at different assumed canopy cover values for the Radiative Transfer Model Intercomparison (RAMI) birch stand in Järvselja, Estonia.