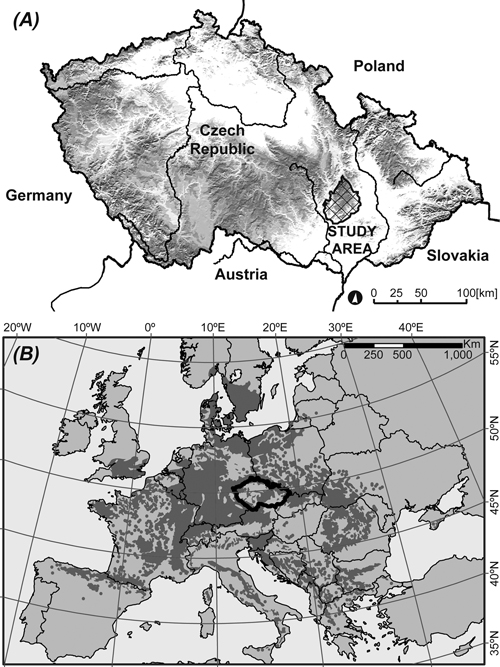
Fig. 1. (A) Study area in the Czech Republic (630 m a.s.l.). (B) The natural distribution of European beech (Fagus sylvatica L.) (http://www.euforgen.org) is shown in the darker shade of gray.
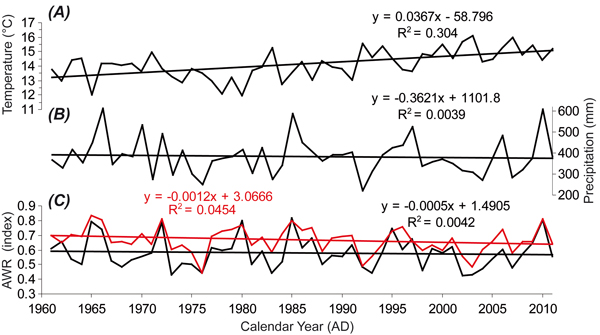
Fig. 2. (A) Mean temperature (°C), (B) Precipitation total (mm) and (C) Soil moisture content (AWR; depth 0–1.30 m in black and depth 0–0.40 m in red) during growing season (April–August) calculated (details in chapter 2.4) for the study site from 1961 to 2011.
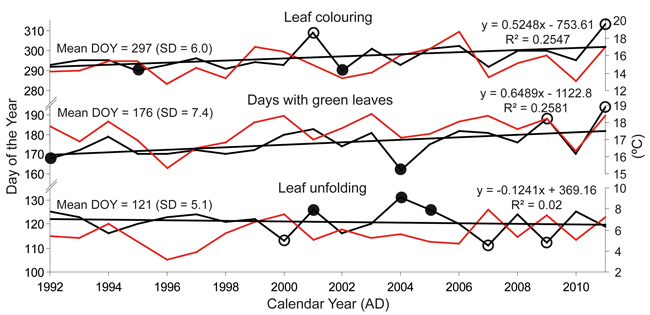
Fig. 3. Trends in leaf unfolding, leaf coloring and days with green leaves for the study site. Red lines show the trend of the climate factor which correlates best with the particular leaf phenological phase (leaf unfolding – March-April average temperature, day with green leaves – March-October maximum temperature, leaf coloring – September-October maximum temperature). Positive (full circles) and negative (empty circles) extremes are indicated.
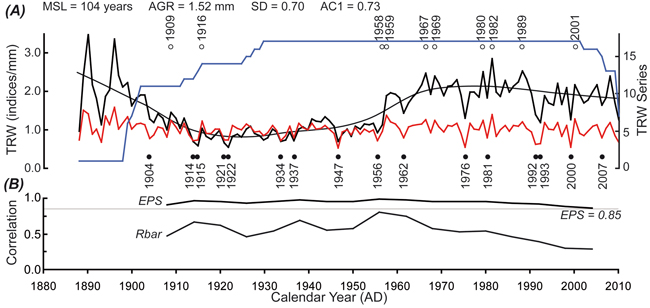
Fig. 4. (A) Growth trend of the raw tree-ring width (TRW) chronology (black) smoothed by Lowess curves, detrended TRW chronology by cubic smoothing spline with 50% frequency cut-off at 100 years (red), replication of the chronology (blue), positive extremes (full circles), negative extremes (empty circles) and basic statistical parameters (MSL – mean segment length; AGR – average growth rate; SD – standard deviation; AC1 – first-order autocorrelation). (B) Expressed population signal (EPS) and inter-series correlation (Rbar) calculated over 12-year windows lagged by 6 years.
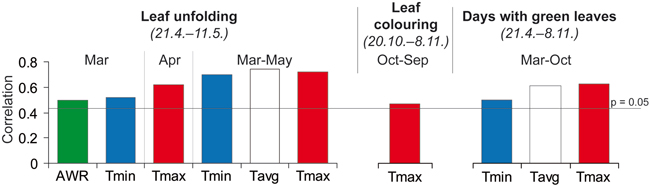
Fig. 5. Pearson’s correlation coefficient of the phenological phases (calendar days shown in italics under the title) with climate factors for the period of 1992–2011. Only significant correlations are listed. Tmin – average monthly minimum temperature, Tavg – average monthly temperature, Tmax – average monthly maxima temperature and AWR – relative water availability in the soil depth 0–1.3 m.
| Table 1. Logistic regressions between the positive and negative extremes (years in which values exceeded ±1.0 standard deviation) of leaf unfolding and the most significant climate factors (Tmin = temperature minimum, Tavg = temperature average, Tmax = temperature maximum, AWR = relatively available water in the soil depth 0–1.3 m) for the period of 1961–2011. Months are represented by their first three letters: Mar is March, Apr is April, Mar–May is March–May. Only the statistics of the independent variables are listed. | ||||||
| Extremes | Climatic Parameter | Estimate | Std.Error | z value | p (>|z|) | Likelihood ratio test |
| Negative | AWR (Mar) | –1.572 | 5.098 | –308.000 | 0.758 | − |
| Tmin (Mar) | –0.250 | 0.379 | –0.661 | 0.508 | − | |
| Tmax (Apr) | –0.158 | 0.325 | –0.486 | 0.627 | − | |
| Tmin (Mar–May) | –0.750 | 0.872 | –0.860 | 0.390 | − | |
| Tavg (Mar–May) | –0.647 | 0.729 | –0.888 | 0.375 | − | |
| Tmax (Mar–May) | –0.497 | 0.578 | –0.859 | 0.390 | − | |
| Positive | AWR (Mar) | 15.930 | 12.700 | 1.254 | 0.210 | − |
| Tmin (Mar) | 1.723 | 1.027 | 1.678 | 0.093 | 0.014 | |
| Tmax (Apr) | 47.100 | 38094.900 | 0.001 | 0.999 | − | |
| Tmin (Mar–May) | 4.350 | 2.276 | 1.911 | 0.056 | 0.002 | |
| Tavg (Mar–May) | 1300.000 | 205354.000 | 0.006 | 0.995 | − | |
| Tmax (Mar–May) | 5.320 | 4.093 | 1.300 | 0.194 | − | |
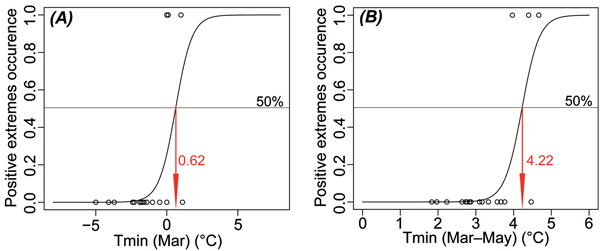
Fig. 6. Results of logistic regression presenting critical values of minimum temperatures (Tmin) in March (A) and March–May period (B) when positive extremes (values exceeding +1.0 standard deviation) of the leaf unfolding occur with 50% probability.
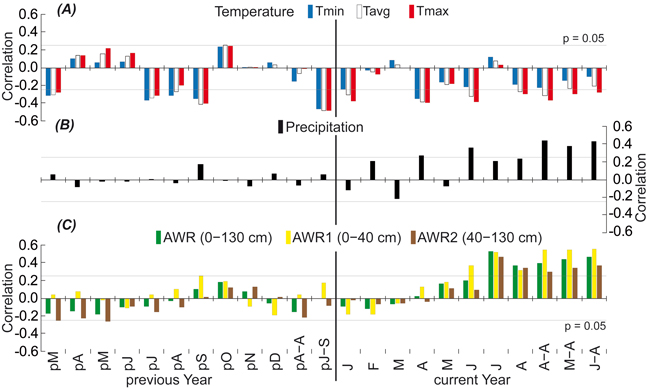
Fig. 7. Response of the regional residual tree-ring index chronology to (A) temperature (Tmin = minimum, Tavg = average, and Tmax = maximum), (B) precipitation and (C) relatively available water in different deep soil profile (AWR = 0–130 cm, AWR1 = 0–40 cm, and AWR2 = 40–130 cm) for the period of 1961–2011. The correlations are presented from March of the previous year (pM) to August of the current year (A) and various seasonal periods. Each month is represented by its first letter: A–A is April–August, J–S is July–September, M–A is May–August, and J–A is June–August. Thin lines indicate the 0.05 significance level.
| Table 2. Logistic regression between the positive and the negative extremes (years in which values exceeded ±1.0 standard deviation) of the tree growth and the most significant climate factors (Tmin = temperature minimum, Tavg = temperature average, Tmax = temperature maximum, Prec = precipitation and relatively available water in different deep soil profile – AWR = 0–130 cm, AWR1 = 0–40 cm, and AWR2 = 40–130 cm) for the period of 1961–2011. Months are represented by their first three letters: Apr is April, Apr–Aug is April–August. Only the statistics of the independent variables are listed. | ||||||
| Extremes | Climatic Parameter | Estimate | Std.Error | z value | p (>|z|) | Likelihood ratio test |
| Negative | AWR1 (Apr−Aug) | –20.432 | 7.462 | –2.738 | 0.006 | 0.0002 |
| AWR2 (Apr−Aug) | –4.949 | 3.696 | –1.339 | 0.181 | − | |
| AWR (Apr−Aug) | –11.441 | 5.482 | –2.087 | 0.037 | 0.013 | |
| Prec (Apr−Aug) | –0.030 | 0.011 | –2.709 | 0.007 | 0.0003 | |
| Tmin (Apr) | 0.344 | 0.329 | 1.046 | 0.296 | − | |
| Tavg (Apr) | 0.407 | 0.257 | 1.582 | 0.114 | − | |
| Tmax (Apr) | 0.350 | 0.195 | 1.794 | 0.073 | 0.066 | |
| Positive | AWR1 (Apr–Aug) | 4.012 | 4.869 | 0.824 | 0.410 | − |
| AWR2 (Apr–Aug) | 1.284 | 2.807 | 0.457 | 0.647 | − | |
| AWR (Apr–Aug) | 2.129 | 3.506 | 0.607 | 0.544 | − | |
| Prec (Apr–Aug) | 0.000 | 0.005 | 0.080 | 0.936 | − | |
| Tmin (Apr) | –0.604 | 0.374 | –1.614 | 0.106 | − | |
| Tavg (Apr) | –0.588 | 0.339 | –1.735 | 0.083 | 0.056 | |
| Tmax (Apr) | –0.464 | 0.274 | –1.692 | 0.091 | 0.061 | |
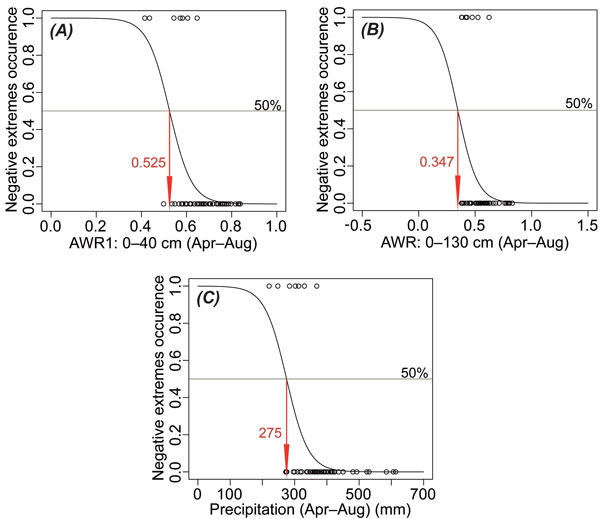
Fig. 8. Results of logistic regression presenting critical values of relative water availability in the soil depth 0–40 cm (AWR1; A) and 0–130 cm (AWR; B) and precipitation (C) all during growing season (April–August) when negative extremes (values exceeding –1.0 standard deviation) of the tree-ring width occur with 50% probability.