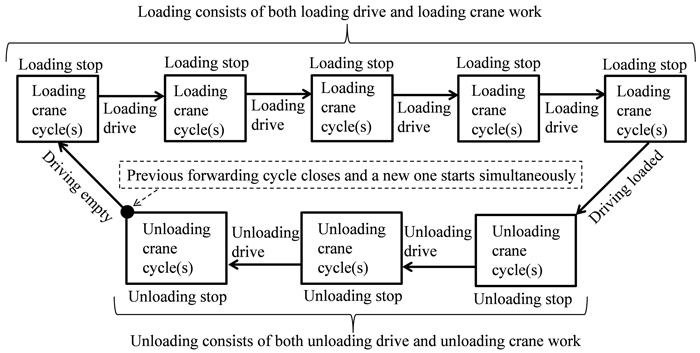
Fig. 1. Work element determination in the TimberLink system.
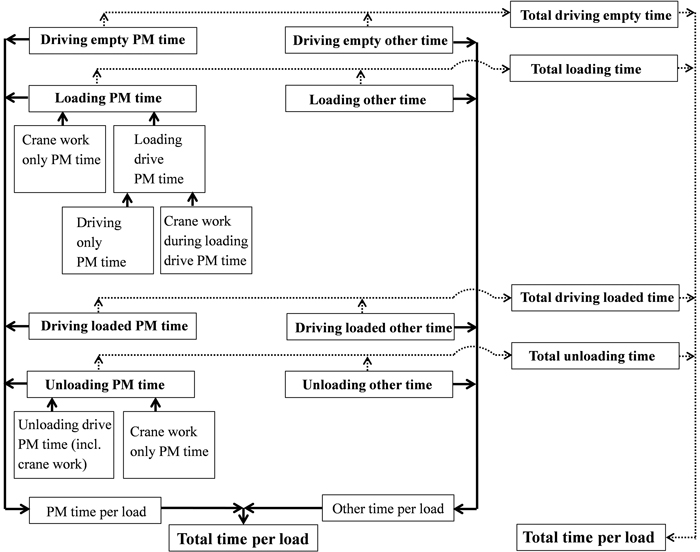
Fig. 2. Two ways to derive the total time per forwarded load; keeping PM (productive machine) time and other time separated (thicker contiguous flow line), or pooling PM and total time for each of four work elements (thinner flow line marked with dots).
| Table 1. Forwarding time consumption (minutes/load). Total time consumption consists of productive machine (PM) time and other time. Means and medians are respectively followed by standard deviations (SD) and median absolute deviations (MAD) in brackets. In addition, 5th, 25th, 75th and 95th percentiles are given to provide general indications of the distribution of observations for each work element. The unit of observation is one load and unit of analysis is a minute per load. The number of observations varied from 8555 to 8868. | ||||||
| Percentiles | ||||||
| Work element | Mean, SD | Median, MAD | 5th | 25th | 75th | 95th |
| Total driving empty time | 7.0 (7.7) | 5.2 [3.2] | 0.3 | 2.5 | 9.1 | 19.1 |
| Driving empty PM time | 4.3 (3.6) | 3.5 [2.1] | 0.2 | 1.7 | 5.9 | 11.1 |
| Driving empty other time | 2.3 (5.8) | 0.5 [0.5] | 0.0 | 0.1 | 2.3 | 9.3 |
| Total loading time | 22.9 (16.0) | 19.9 [6.6] | 8.5 | 13.9 | 27.6 | 45.5 |
| Loading PM time | 21.0 (11.8) | 18.8 [6.1] | 8.2 | 13.4 | 25.9 | 40.0 |
| Loading other time | 1.9 (7.3) | 0.5 [0.4] | 0.1 | 0.2 | 1.4 | 7.7 |
| Crane work only PM time | 14.3 (7.2) | 13.0 [3.7] | 6.0 | 9.7 | 17.4 | 26.2 |
| Simultaneous crane work and driving a) | 1.4 (1.5) | 0.9 [0.6] | 0.1 | 0.4 | 1.9 | 4.2 |
| Driving only PM time b) | 5.3 (5.0) | 4.2 [2.2] | 0.7 | 2.3 | 6.8 | 13.2 |
| Loading drive PM time = a + b) | 6.7 (5.7) | 5.6 [2.7] | 1.1 | 3.1 | 8.7 | 16.0 |
| Total driving loaded time | 4.8 (4.2) | 3.7 [2.2] | 0.5 | 1.8 | 6.5 | 12.7 |
| Driving loaded PM time | 3.8 (3.6) | 2.8 [1.9] | 0.1 | 1.2 | 5.3 | 11.1 |
| Driving loaded other time | 0.6 (1.6) | 0.3 [0.2] | 0.0 | 0.1 | 0.6 | 2.0 |
| Total unloading time | 10.2 (9.9) | 8.2 [2.5] | 3.7 | 6.0 | 11.3 | 23.0 |
| Unloading PM time | 8.8 (5.8) | 7.5 [2.2] | 3.5 | 5.6 | 10.2 | 18.8 |
| Unloading other time | 1.4 (6.2) | 0.3 [0.3] | 0.0 | 0.1 | 1.1 | 4.7 |
| Crane work only PM time | 7.4 (3.8) | 6.8 [1.7] | 3.2 | 5.2 | 8.8 | 13.4 |
| Unloading drive PM time 1) | 1.4 (2.8) | 0.5 [0.4] | 0.0 | 0.2 | 1.5 | 6.1 |
| Total time per load | 45.8 (24.1) | 42.1 [11.8] | 19.1 | 31.0 | 55.3 | 84.5 |
| PM time | 39.3 (17.4) | 36.8 [10.1] | 17.3 | 27.5 | 48.2 | 68.2 |
| Other time | 6.5 (11.9) | 3.4 [2.2] | 0.6 | 1.6 | 7.1 | 21.6 |
| 1) Can also include simultaneous crane work | ||||||
| Table 2. Descriptive forwarder work variables. Means and medians are respectively followed by standard deviations (SD) and median absolute deviations (MAD) in brackets. In addition, 5th, 25th, 75th and 95th percentiles are given. The unit of observation is one load. | |||||||
| Percentiles | |||||||
| Variable | Sort | Mean, SD | Median, MAD | 5th | 25th | 75th | 95th |
| Driving empty distance | m/load | 256.3 (234.5) | 199.4 [129.3] | 4.9 | 90.6 | 358.1 | 702.1 |
| Loading drive distance | m/load | 236.8 (255.3) | 183.0 [91.0] | 37.3 | 102.5 | 289.3 | 596.1 |
| Driving loaded distance | m/load | 181.3 (171.8) | 134.8 [95.7] | 3.1 | 52.4 | 262.4 | 524.2 |
| Unloading drive distance | m/load | 71.4 (166.4) | 18.6 [17.2] | 0.0 | 4.3 | 72.4 | 305.4 |
| Extraction distance 1) | m/load | 219.0 (177.5) | 173.9 [99.8] | 24.8 | 87.6 | 302.1 | 578.6 |
| Total driven distance | m/load | 779.8 (518.5) | 666.2 [275.0] | 197.2 | 425.5 | 1006.8 | 1720.2 |
| Driving empty speed 2) | km/h | 3.4a (1.0) | 3.3 [0.5] | 1.8 | 2.8 | 3.9 | 5.1 |
| Loading drive speed | km/h | 2.1b (0.5) | 2.0 [0.3] | 1.3 | 1.7 | 2.4 | 3.0 |
| Driving loaded speed | km/h | 2.9c (0.8) | 2.8 [0.5] | 1.6 | 2.4 | 3.4 | 4.4 |
| Loading crane cycle numbers 3) | cycles/load | 34.9a (12.0) | 34.0 [7.0] | 17.0 | 27.0 | 42.0 | 56.0 |
| Unloading crane cycle numbers | cycles/load | 16.7b (5.9) | 16.0 [3.0] | 9.0 | 13.0 | 20.0 | 25.0 |
| Loading crane cycle time | s/cycle | 23.7 (5.2) | 22.5 [2.8] | 17.6 | 20.2 | 26.2 | 33.3 |
| Unloading crane cycle time | s/cycle | 23.4 (5.3) | 22.5 [3.0] | 16.9 | 19.8 | 25.9 | 33.0 |
| Proportion of crane work during loading drive PM time | % | 22.1 (16.3) | 18.3 [9.1] | 3.1 | 10.4 | 29.8 | 53.8 |
| 1) Extraction distance = mean of Driving loaded and Driving empty distances. 2) Different superscript letters within speed variables indicate significant differences (p < 0.001, one-way ANOVA with Tukey test, n = 8868). 3) Different superscript letters within crane cycle numbers indicate significant differences (p < 0.001, paired t-test, n = 8868). Differences between the pairs were normally distributed. | |||||||
| Table 3. Forwarding time consumption (second/load) in total (Tot.), during PM work and during Other time (Other) as functions of extraction distance (Ext.Dist.) (metre). Models were also derived separately for work elements Driving empty (D.E.), Loading (L.), Driving loaded (D.L.) and Unloading (Unl.). SE = standard error, n = number of loads, S = standard error of the estimate. Ext.Dist. = mean of Driving loaded and Driving empty distances. | |||||||||
| Dependent variable | Predictor | Coefficient | SE coeff. | T-value | Model | Bias correction | |||
| F | R2(adj) (%) | S | n | ||||||
| Ln(Tot.) | Ln(Ext.Dist.) | 0.20568 | 0.00440 | 46.70 | 2180.63 | 19.8 | 0.412911 | 8857 | 1.09104 |
| Constant | 6.7821 | 0.0225 | 301.25 | ||||||
| Ln(PM) | Ln(Ext.Dist.). | 0.20492 | 0.00403 | 50.85 | 2585.46 | 22.6 | 0.377802 | 8857 | 1.07189 |
| Constant | 6.6508 | 0.0206 | 322.87 | ||||||
| Ln(Tot. Other) | Ln(Ext.Dist.) | 0.2438 | 0.0116 | 21.06 | 443.57 | 4.8 | 1.08514 | 8856 | 1.85197 |
| Constant | 4.1012 | 0.0592 | 69.32 | ||||||
| Ln(D.E. Tot.) | Ln(Ext.Dist.) | 0.82937 | 0.00895 | 92.71 | 8594.49 | 49.3 | 0.837579 | 8843 | 1.27755 |
| Constant | 1.3692 | 0.0457 | 29.93 | ||||||
| Ln(D.E. PM) | Ln(Ext.Dist.) | 0.91374 | 0.00772 | 118.36 | 14009.34 | 61.8 | 0.692162 | 8676 | 1.13247 |
| Constant | 0.5266 | 0.0396 | 13.28 | ||||||
| Ln(L. Tot.) | Ln(Ext.Dist.) | 0.07133 | 0.00575 | 12.41 | 153.91 | 1.7 | 0.539013 | 8857 | 1.16125 |
| Constant | 6.7165 | 0.0294 | 228.54 | ||||||
| Ln(L. PM) | Ln(Ext.Dist.) | 0.08332 | 0.00539 | 15.45 | 238.80 | 2.6 | 0.505486 | 8857 | 1.13196 |
| Constant | 6.5926 | 0.0276 | 239.20 | ||||||
| Ln(D.L. Tot.) | Ln(Ext.Dist.) | 0.67811 | 0.00797 | 85.06 | 7235.81 | 45.0 | 0.747323 | 8857 | 1.24241 |
| Constant | 1.8581 | 0.0407 | 45.60 | ||||||
| Ln(D.L. PM) | Ln(Ext.Dist.) | 0.85758 | 0.00877 | 97.73 | 9551.91 | 52.8 | 0.770664 | 8555 | 1.23240 |
| Constant | 0.6436 | 0.0452 | 14.25 | ||||||
| Ln(Unl. Tot.) | Ln(Ext.Dist.) | 0.06774 | 0.00589 | 11.50 | 132.34 | 1.5 | 0.552018 | 8857 | 1.19892 |
| Constant | 5.8954 | 0.0301 | 195.87 | ||||||
| Ln(Unl. PM) | Ln(Ext.Dist.) | 0.07086 | 0.00526 | 13.48 | 181.77 | 2.0 | 0.492719 | 8857 | 1.14050 |
| Constant | 5.7843 | 0.0269 | 215.31 | ||||||
| Ln(D.E. Other) | Ln(Ext.Dist.) | 0.7479 | 0.0228 | 32.77 | 1073.97 | 11.3 | 2.02959 | 8402 | 4.12739 |
| Constant | –0.420 | 0.118 | –3.58 | ||||||
| Ln(L. Other) 1) | Ln(Ext.Dist.) | –0.0165 | 0.0158 | –1.05 | 1.09 | 0.0 | 1.47879 | 8853 | 3.38023 |
| Constant | 3.6225 | 0.0807 | 44.91 | ||||||
| Ln(D.L. Other) | Ln(Ext.Dist.) | 0.2328 | 0.0174 | 13.40 | 179.43 | 2.1 | 1.57333 | 8508 | 2.74649 |
| Constant | 1.3921 | 0.0892 | 15.60 | ||||||
| Ln(Unl. Other) | Ln(Ext.Dist.) | 0.0677 | 0.0183 | 3.70 | 13.66 | 0.1 | 1.71746 | 8854 | 4.51765 |
| Constant | 2.5647 | 0.0937 | 27.38 | ||||||
| p-value < 0.001 for all the coefficient estimates (including both ln(Ext.Dist) and constant) and models – 1)except, p = 0.296 for both Ln(Ext.Dist) and the model. When estimating dependent variables, the predicted dependent variable may be multiplied by the given correction factor for logarithmic bias (i.e. bias correction). For example: Driving empty = 1.27755×exp(1.3692 + 0.82937×ln(Ext.Dist.)). | |||||||||
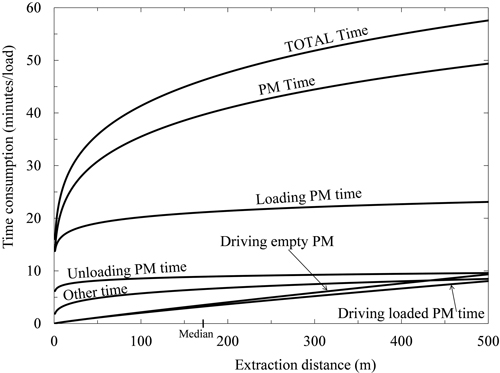
Fig. 3. The total and productive machine time (PM time) consumption as a function of extraction distance (mean of Driving unloaded and Driving loaded distances). The median extraction distance is marked on the horizontal axis (see Table 2). PM time is also shown for each of the four work elements Loading (crane work and driving included), Unloading (crane work and driving included), Driving empty, Driving loaded, and Other time. Applied models are taken from Table 3 and corrected for logarithmic bias.
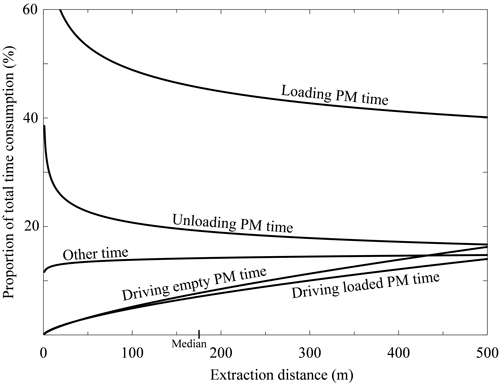
Fig. 4. PM times’ proportions of total time consumption as a function of extraction distance (mean of Driving loaded and Driving unloaded distances). The median extraction distance is marked on the horizontal axis (see Table 2). Applied models are taken from Table 3 and corrected for logarithmic bias.
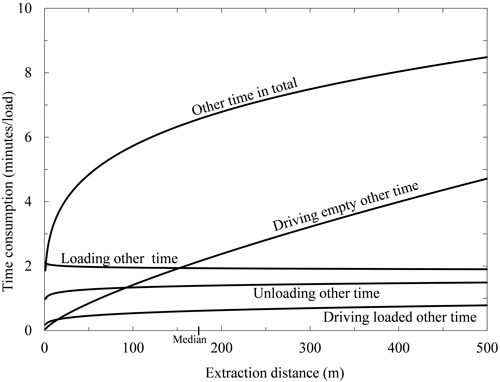
Fig. 5. Other time as a function of extraction distance (mean of Driving loaded and Driving unloaded distances). The median extraction distance is marked on the horizontal axis (see Table 2). Total other time is also shown for each of the four work elements Loading (crane work and driving included), Unloading (crane work and driving included), Driving empty and Driving loaded. Applied models are taken from Table 3 and corrected for logarithmic bias.
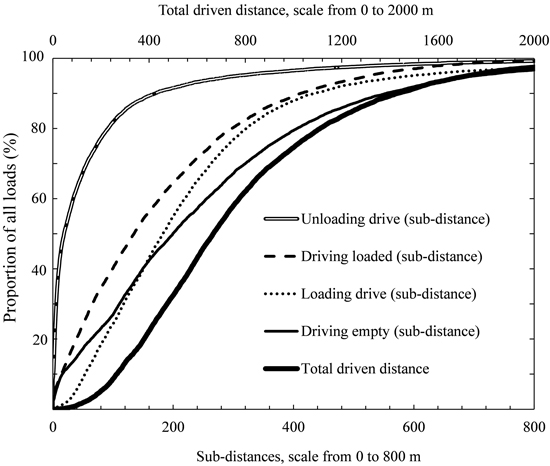
Fig. 6. Cumulative distribution of distances driven during indicated work elements required to fulfil a load (including all work elements pooled, i.e. total driven distance). For instance, ca. 90% of all loads had an Unloading drive distance less than 200 m per load and ca 40% of all loads had a total driving distance less than 600 m per load.
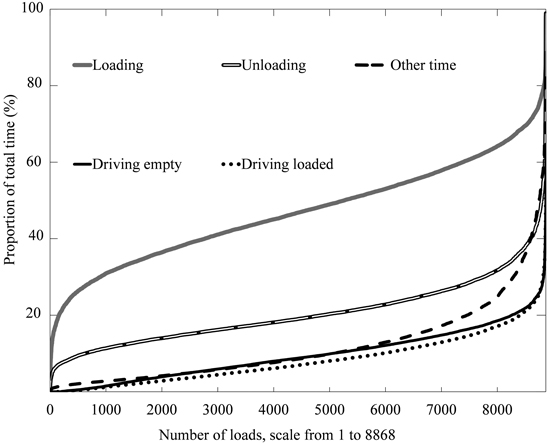
Fig. 7. Work elements’ relative proportions of total time consumption during forwarding of a load, ordered according to size of proportion size within each work element. The total number of observations (loads) is 8868. For instance, for approximately half of the loads, the Loading PM time constituted 40–60% of the total time (for ca. 7000 observations the proportion was equal to or less than 60%, and for ca. 3000 observations it was equal to or less than 40%; 7000–3000 = 4000). Similarly, for more than 8000 of the observations, the relative time spent on Driving empty was below 20% of the total time spent on forwarding the load.