| Table 1. Comparison of stand characteristics measured in formerly managed beech coppices at the end of the rotation period (27 years) in 1972. The two plots have been started of being converting since 1972 to high forest following two management options: natural evolution (unthinned control) and periodic thinning. For the thinned plot, data are reported, either before (bt) or after (at) each thinning. The reduction in stools and basal area (%) is also reported (brackets); dg: quadratic mean diameter; ddom: top diameter; hdom: dominant height. | ||||||
| ID | Inventory | Stools | Basal area | dg | ddom | hdom |
| Control | 1972 | 7518 | 27.4 | 6.8 | 18.6 | 11.2 |
| 1982 | 6846 | 38.2 | 8.4 | 23.0 | 15.7 | |
| 1987 | 3920 | 40.9 | 11.5 | 29.0 | 20.1 | |
| 2002 | 2580 | 45.3 | 15.0 | 33.0 | 25.1 | |
| 2012 | 2046 | 48.15 | 17.3 | 35.2 | 26.7 | |
| Thinned | 1972 bt | 7407 | 27.5 | 6.8 | 18.6 | 11.2 |
| 1972 at | 2222 (–70%) | 17.3 (–37%) | 9.6 | 15.9 | 10.7 | |
| 1982 | 2182 | 29.4 | 12.8 | 22.1 | 15.7 | |
| 1987 bt | 2076 | 35.2 | 14.1 | 24.9 | 17.6 | |
| 1987 at | 706 (–66%) | 19.7 (–44%) | 18.8 | 24.8 | 17.6 | |
| 2002 bt | 702 | 33.5 | 24.6 | 33.6 | 24.2 | |
| 2002 at | 414 (–41%) | 23.8 (–29%) | 27.1 | 33.5 | 24.2 | |
| 2012 | 412 | 29.8 | 30.4 | 37.5 | 25.6 | |
| Table 2. (Top): Statistics on annual litter production and its partitioning (measured during1992–2014), leaf area index (LAI4; 1999–2014) and canopy transmittance (Trasm; 1999–2014) in control and thinned plots. The number of sampling points in both plots was 9 for litterfall and LAI4 measurements and 36 for canopy transmittance measurements. (Bottom): Growth efficiency estimates obtained after comparison of inventories (1987–2002; 2003–2014) at stand (Estand) and individual tree level (Etree). ∆G: basal area increment between the considered inventories. | |||||||||
| Stand ID | Litter components (Mg ha–1) | LAI4 (m2 m–2) | Trasm. % | ||||||
| Leaves | Woody | Nuts | Husks | Other | Total | ||||
| Control | Average | 3.785 | 0.858 | 0.135 | 0.331 | 0.127 | 5.237 | 6.1 | 1.2 |
| SE | 0.089 | 0.081 | 0.041 | 0.079 | 0.031 | 0.159 | 0.1 | 0.2 | |
| Min | 2.760 | 0.278 | <0.001 | 0.010 | <0.001 | 3.757 | 4.5 | 0.3 | |
| Max | 4.403 | 1.640 | 0.888 | 1.672 | 0.481 | 6.631 | 7.0 | 3.0 | |
| CV | 11.3 | 45.1 | 144.5 | 114.6 | 116.4 | 14.5 | 10.9 | 59.5 | |
| Thinned | Average | 3.341 | 0.544 | 0.115 | 0.294 | 0.049 | 4.346 | 5.0 | 4.0 |
| SE | 0.132 | 0.086 | 0.044 | 0.085 | 0.019 | 0.189 | 0.2 | 0.9 | |
| Min | 1.889 | 0.097 | <0.001 | <0.001 | <0.001 | 2.619 | 2.3 | 0.4 | |
| Max | 4.709 | 1.671 | 0.982 | 1.780 | 0.321 | 6.311 | 6.7 | 16.7 | |
| CV | 18.9 | 76.0 | 183.3 | 137.9 | 186.8 | 20.8 | 21.1 | 108.5 | |
| Stand ID | 1987–2002 | 2003–2014 | |||||||
| ∆G | LAI4 | Estand | Etree | ∆G | LAI4 | Estand | Etree | ||
| Control | 4.4 | 5.9 | 0.74 | 0.0003 | 2.9 | 6.1 | 0.46 | 0.0002 | |
| Thinned | 13.8 | 5.6 | 2.47 | 0.0035 | 6.0 | 4.8 | 1.26 | 0.0030 | |
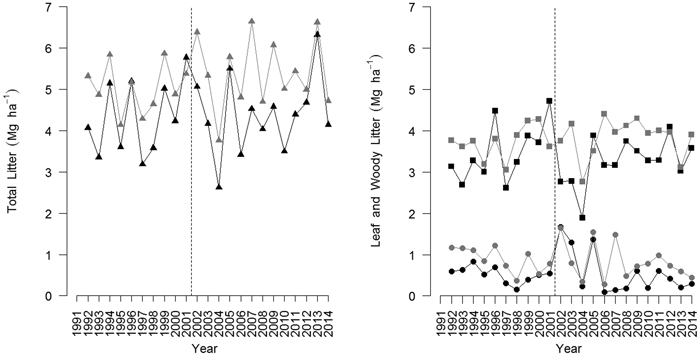
Fig. 1. Time pattern of total litter (triangles), leaf (squares) and woody (circles) litter production in the beech coppices under conversion to high forests following two management options: periodic thinning (black) and unthinned control (grey). The vertical dashed line indicates the last thinning undertaken in the thinned stand. View larger in new window/tab.
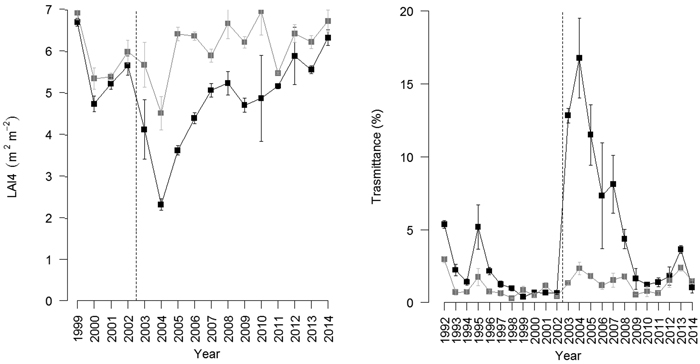
Fig. 2. (Left): Time pattern of leaf area index calculated from LAI-2000 PCA (LAI4, excluding the outer ring) in the beech coppices under conversion to high forests following two management options: periodic thinning (black) and unthinned control (grey). The vertical dashed line indicates the last thinning undertaken in the thinned stand. (Right): Time pattern of canopy transmittance in thinned (black) and unthinned (grey) stands from 1992–2014. The vertical dashed line indicates the last thinning undertaken in the thinned stand. View larger in new window/tab.