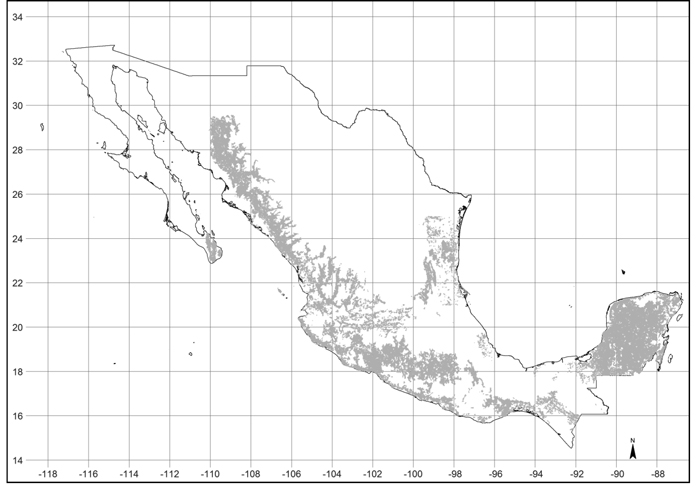
Fig. 1. Geographical distribution of tropical dry forest in Mexico (gray area). Data: INEGI 2010.
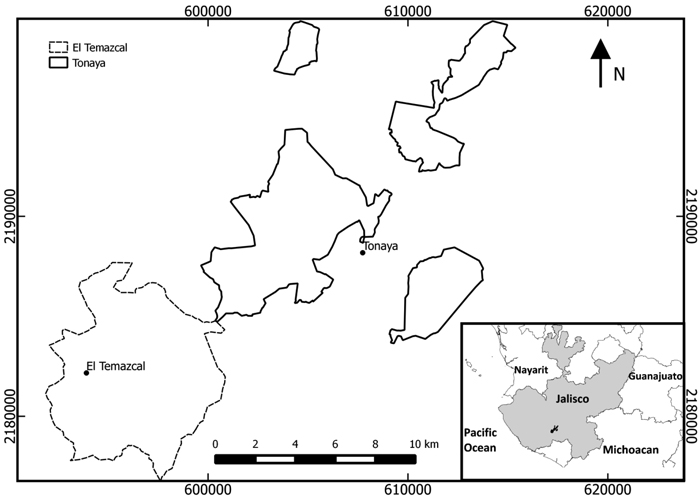
Fig. 2. Location of communities in Jalisco state, western Mexico in which shifting cultivation was investigated (EPSG projection: 32613-wgs84/utm zone 13N).
| Table 1. Mean and standard deviation (in parenthesis) of carbon stocks and other characteristics of sampled sites for shifting cultivation plots and different forest categories in study areas. |
| Class | No. of sites | Soil C (Mg ha–1) | AGC (Mg ha–1) | Total C (Mg ha–1) | DBH (cm) | No. of trees/ha with DBH ≥ 2.5cm | No. of stems/ha (includes multi-stemmed trees) |
| FP | 23 | 52.22 (18.51) | 7.03 (3.73) | 59.25 (23.16) | 9.1 (8.8) | 1096 (533) | 2202 (1110) |
| FP1 | 8 | 40.65 (9.81) | 6.46 (3.41) a | 47.12 (8.57) | 7.4 (6.3) | 1318 (407) | 2278 (907) |
| FP2 | 5 | 53.23 (22.66) | 7.97 (4.85) a, b | 61.21 (20.30) | 8.6 (8.5) | 1025 (86) | 1725 (1124) |
| FP3 | 10 | 60.97 (27.85) | 7.01 (3.71) a | 67.99 (29.21) | 11.2 (10.7) | 955 (407) | 2380 (1283) |
| OG | 6 | 44.37 (16.03) | 24.31 (6.95) b | 68.68 (14.46) | 40.4(34.0) | 1154 (140) | 1750 (466) |
| OF | 15 | 60.97 (27.85) 1 | 9.66 (4.51) a, b | 70.63 | 10.7 (1.0) | 1221 (497) | 2658 (1144) |
| CP | 4 | 62.72 (15.85) | NA | 62.72 (15.85) | NA | NA | NA |
| PL | 6 | 53.69 (17.08) | NA | 53.69 (17.08) | NA | NA | NA |
| PA | 5 | 24.33 (7.40) | NA | 24.33 (7.40) | NA | NA | NA |
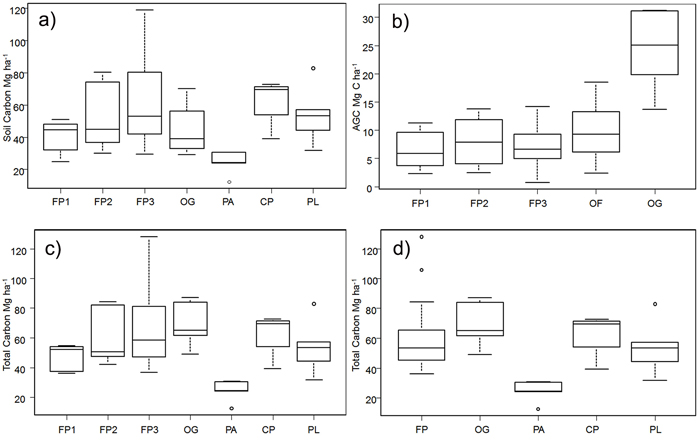
Fig. 3. Carbon stocks in the study area for shifting cultivation plots and different forest categories: a) Above-ground C split by the fallow age classes, b) Soil carbon split by the fallow age class, c) Total carbon split the fallow age class and d) Total carbon in the three separate fallow phases; FP1 = fallow phase of shifting cultivation years 3–6; FP2 = fallow phase of shifting cultivation years 7–9; FP3 = fallow phase of shifting cultivation years 10–20; FP = all fallow phases of shifting cultivation; OF = old–fallow forest (> 20 years); CP = cultivation phase of shifting cultivation; OG = old growth forest; PA = permanent agriculture; PL = permanent pasture; AGC = Above-ground C. For each plot, the horizontal lines forming the top and bottom of each box respectively indicate the 25th and 75th percentiles (interquartile range) of the dataset and the horizontal middle one indicates the median. The whiskers of each plot extend to ±1.5 interquartile range, to show variability outside the 25th and 75th quantiles and statistical outliers are represented by a dot. View larger in new window/tab
| Table 2. Carbon impacts of shifting cultivation versus permanent agriculture for production of 1 Mg yr–1 of maize. See Suppl. file 2, Table S2 for calculation details. |
| PA | SC |
| Maize yield (Mg ha–1) | 3.76 | 1.68 |
| Cropping area needed to produce 1 Mg maize (ha) | 0.27 | 0.60 |
| Area required for fallow (ha) | - | 3.00 |
| Total area required for agricultural system (ha) | 0.27 | 3.6 |
| Land spared for OF (ha) | 3.33 | - |
| Carbon stock in cultivated area (Mg) | 6.47 | 37.63 |
| Carbon stock in fallow areas (Mg) | - | 172.82 |
| Carbon stock in OF area (Mg) | 235.20 | - |
| Total carbon stock (Mg) | 241.67 | 210.46 |
| Total carbon stock in baseline (absence of any farming) (Mg) | 254.27 | 254.27 |
| Loss of carbon stock (Mg) | 12.60 | 43.81 |
| Annual carbon loss, over nominal production period of 20 years for production on 1Mg maize per year (Mg) | 0.63 | 2.19 |
| Table 3. Carbon impacts of changing lengths of fallow. Average carbon stocks for shifting cultivation plots over three different fallow lengths (6-year, 12-year and 24-year cycles). See Suppl. file 2, Table S3 for calculation details. |
| SC 6-year cycle | SC 12-year cycle | SC 24-year cycle |
| Maize yield (Mg ha–1) | 1 | 1 | 1 |
| Rotation 1 | 3 | 6 | 12 |
| Cultivation area needed per year for production of 1 Mg maize (ha) | 0.60 | 0.60 | 0.60 |
| Area under fallow (ha) | 1.20 | 3.00 | 6.60 |
| Area remaining under OF (ha) | 5.40 | 6.60 | 0.00 |
| Total area including fallow plots (ha) | 1.80 | 3.60 | 7.20 |
| Carbon stock in cultivation area (Mg) | 37.63 | 37.63 | 37.63 |
| Carbon stock in fallowed area (Mg) | 56.54 | 172.82 | 420.76 |
| Carbon stock in OF area (Mg) | 381.40 | 254.27 | 0.00 |
| Total carbon stock (Mg) | 475.58 | 464.72 | 458.39 |
| Carbon stock in baseline (absence of any farming) (Mg) | 508.54 | 508.54 | 508.54 |
| Loss in carbon stock (Mg) | 32.96 | 43.82 | 50.15 |
| Annual carbon loss, over nominal production period of 20 years for production on 1 Mg maize per year (Mg) | 1.65 | 2.19 | 2.51 |
| Table 4. Effect of land under pressure on carbon stocks and emissions when maize production rate increased by a factor of 4 over the shifting cultivation area. See Suppl. file 2, Table S4 for calculation details. |
| SC 6 years with four farmers |
| Cropping area per year needed to produce 1 Mg of maize (ha) | 0.60 |
| Total production area needed (ha) | 7.20 |
| Area under cultivation (ha) | 2.40 |
| Area fallowed (ha) | 4.80 |
| Carbon stocks in cultivation area (Mg) | 150.53 |
| Carbon stocks in fallowed area (Mg) | 226.18 |
| Total carbon stocks (Mg) | 376.70 |
| Carbon stock in baseline (absence of any farming) (Mg) | 508.54 |
| Carbon loss due to cultivation | 131.83 |
| Carbon loss per Mg maize produced (Mg) | 32.96 |
| Emissions per Mg maize year–1, annualised over nominal 20 years (Mg) | 1.65 |